The Role of the Belt and Road Initiative in the Green Transformation of the Maritime Industry: From Trust Deficit to Sustainable Partnerships
WANG Yongxin Affiliations & Notes
President of China Merchants Energy Shipping Co., Ltd.
This article examines how the Belt and Road Initiative can convert a trust deficit into sustainable partnerships that deliver measurable green outcomes along Maritime Silk Road corridors. A mechanism-anchored framework is developed and applied in which three BRI roles—Infrastructure Enabler, Standards Coordinator, and Green-Finance Risk-Sharer—lower governance and data frictions and thereby raise onshore power supply utilization, reduce well-to-wake emissions intensity, and improve port efficiency. The empirical design combines difference-in-differences with event-study coefficients, selective synthetic control for flagship ports, mediation through a compact Trust-Deficit Index, and a log-mean Divisia decomposition that separately attributes emissions gains to shore power, fuel switching, and operational efficiency.
Synthesis of peer-reviewed evidence along the MSR shows that BRI-linked policy exposure is associated with higher port efficiency and with air-quality improvements, while technical studies and incentive models identify OPS and calibrated subsidies as practical adoption levers. The article's innovations are fourfold: it formalizes the trust-deficit channel as measurable governance and data-credibility indices; it ties role-specific treatments to auditable, corridor-comparable outcomes; it integrates verification into identification so results are finance-grade; and it provides policy-ready levers—mutual recognition of standards and verifiers, API auditability, and covenants that link financing terms to independently verified utilization and fuel-switch thresholds. The results imply that BRI can catalyze green transformation when assets, standards, and finance are designed as a single system with verification at its core, converting trust deficits into durable, sustainable partnerships.
Keywords :
Belt and Road Initiative; Green Transformation; Trust Deficit; Sustainable Partnerships; Onshore Power Supply
1. Introduction
The green transformation of the maritime industry depends on credible, interoperable data and trust-based collaboration among borders, firms, and regulators. Corridors under the Belt and Road Initiative (BRI), particularly the Maritime Silk Road (MSR), concentrate port and shipping flows where technologies such as Onshore Power Supply (OPS), digital port–ship coordination, and low-carbon fuels can substantially reduce Well-to-Wake (WtW) emissions and local pollution. However, deployment and sustained utilization remain uneven. A persistent constraint, identified by scholars and practitioners alike, is the trust deficit, which encompasses concerns over governance, including procurement transparency, regulatory oversight, and co-investor diversity, as well as data credibility, such as verification of emissions and OPS use, compatibility between reporting regimes, and secure digital interoperability.
Empirically, existing literature provides partial insights. Cross-port frontier analyses along MSR nodes reveal that operational efficiency often surpasses environmental performance and recommend OPS and terminal electrification as effective levers (Dong et al., 2019). These studies offer operational guidance but do not examine cross-jurisdictional standards or verification regimes that could enable trusted corridors. Difference-in-Differences (DID) evaluations treat MSR policy as a quasi-natural experiment and demonstrate significant improvements in coastal port efficiency through infrastructure, human capital, and industrialization channels, with stronger effects in southern and large-city ports (Huang, Huo, and Xiao, 2025). Complementary DID research indicates that MSR policy influences SO₂ emissions at Chinese ports and interacts with domestic emission control policies and scale variables (Wang et al., 2025). However, these works do not connect outcomes to verifiable OPS or carbon-accounting standards. Game-theoretic models of OPS adoption suggest that calibrated subsidies and readiness conditions among governments, ports, and carriers can shift equilibria toward cooperation (Cheng, Lin, and Li, 2024). Nonetheless, such models often overlook international standards, auditability, or performance-linked finance that could institutionalize trust and sustained utilization. Practitioner analyses further highlight barriers in cross-border data sharing, customs/IT harmonization, and data-protection risks, which erode trust and increase transaction costs for green collaboration (Nitsche, 2020; Serafimov, Stets, and Shkolyk, 2021). Despite these contributions, a key evidence gap remains: no integrated, corridor-scale study validates the mechanism linking BRI roles to trust-deficit reduction, partnership formation, and measurable green outcomes, including OPS utilization, WtW emissions, and turnaround efficiency, while incorporating explicit standards, verification, and finance covenants. This study addresses this gap by proposing a mechanism-anchored, corridor-comparative design that defines trackable governance and data-credibility metrics, links them causally where feasible to BRI roles as Infrastructure Enabler, Standards Coordinator, and Green-Finance Risk-Sharer, and quantifies green outcomes using auditable, WtW-compatible measures (Zhang et al., 2022).
There are four research questions (RQs), each framed by the required keywords and measurable outcomes:
- RQ1 (Infrastructure Enabler): Do BRI-related infrastructure actions, such as OPS electrification and berth/process upgrades, improve green outcomes via operational capability gains, for example, reduced waiting/turnaround times and higher OPS utilization?
- RQ2 (Standards Coordinator): Does standards/data interoperability, including OPS IEC/ISO/IEEE 80005 readiness, DCS–MRV reconciliation, and API conformance, reduce the trust deficit and increase utilization of OPS and just-in-time arrivals?
- RQ3 (Green-Finance Risk-Sharer): Do risk-sharing and performance-linked instruments, such as concessionality, guarantees, and covenants tied to verified OPS/fuel-switch KPIs, raise adoption and sustained use relative to financing without covenants?
- RQ4 (Mediation): What share of green outcomes is mediated by improvements in trust-deficit indicators along governance and data-credibility dimensions?
The contributions of this study are threefold. Conceptually, it operationalizes the pathway from trust deficit to sustainable partnerships within a BRI corridor lens, explicitly naming and testing the three BRI roles. Methodologically, it adapts DID/event-study and synthetic control strategies from MSR policy impact studies to green outcomes and embed mediation via a compact Trust-Deficit Index. Empirically, it specifies auditable metrics: OPS utilization measured as connection hours and eligible-call plug-in share, WtW gCO2e per TEU-nm/DWT-nm with decomposition into OPS, fuel switch, and operational efficiency components, and turnaround efficiency—all anchored to verification practices and interoperable data sources like IMO DCS, EU MRV, and submetered OPS logs. The remainder of the paper proceeds with a conceptual framework in Chapter 2 and a consolidated methods section in Chapter 3, followed by results, discussion, implications, limitations, and conclusions.
2. Conceptual Framework
The trust deficit is defined as the observable shortfall in governance assurance, which includes open tendering and PPP disclosure, independent regulator oversight, and co-investor diversity, as well as data/carbon credibility, encompassing third-party verification, reconciliation between IMO DCS and EU MRV where applicable, and OPS submetering integrity with time-stamped connection/disconnection and calibrated kWh. These deficits heighten perceived counterparty and information risks, thereby inhibiting sustained cooperation.
Three BRI roles are mapped to pathways that plausibly bridge the trust deficit to sustainable partnerships and green outcomes:
- The Infrastructure Enabler role enhances capability and efficiency gains through OPS-ready berths, electrified cranes, and digital port call processes, which lower perceived operational risk and promote higher technology adoption and utilization.
- The Standards Coordinator role fosters interoperability and verification via IEC/ISO/IEEE 80005 compliance at both corridor ends, DCS–MRV reconciliation, and API conformance to IMO/UN/CEFACT, yielding credible, comparable data and reduced transaction costs for cross-jurisdictional partnerships.
- The Green-Finance Risk-Sharer role employs concessional terms, guarantees/insurance, and performance-linked covenants tied to independently verified OPS/fuel-switch KPIs, ensuring disciplined investment and sustained use.
From these mappings, propositions are derived aligned with four RQs: P1—exposure to BRI infrastructure investments raises port efficiency and, conditional on standards readiness, green outcomes; P2—standards/data coordination reduces trust-deficit scores and increases utilization; P3—performance-linked green finance improves adoption and sustained use relative to financing without covenants. Claims are limited to those supported by literature from 2015 to 2030 and frame causal tests where identification is credible. Figure 1 visualizes the mechanism, specifying measurable nodes, mediators, and exogenous controls such as trade volumes, vessel mix, domestic policy shocks like DECA/AFIR, and grid carbon intensity.
Figure 1. Mechanism from BRI Roles to Reduced Trust Deficit, Partnerships, and Green Outcomes (Source: Dong G., et al.)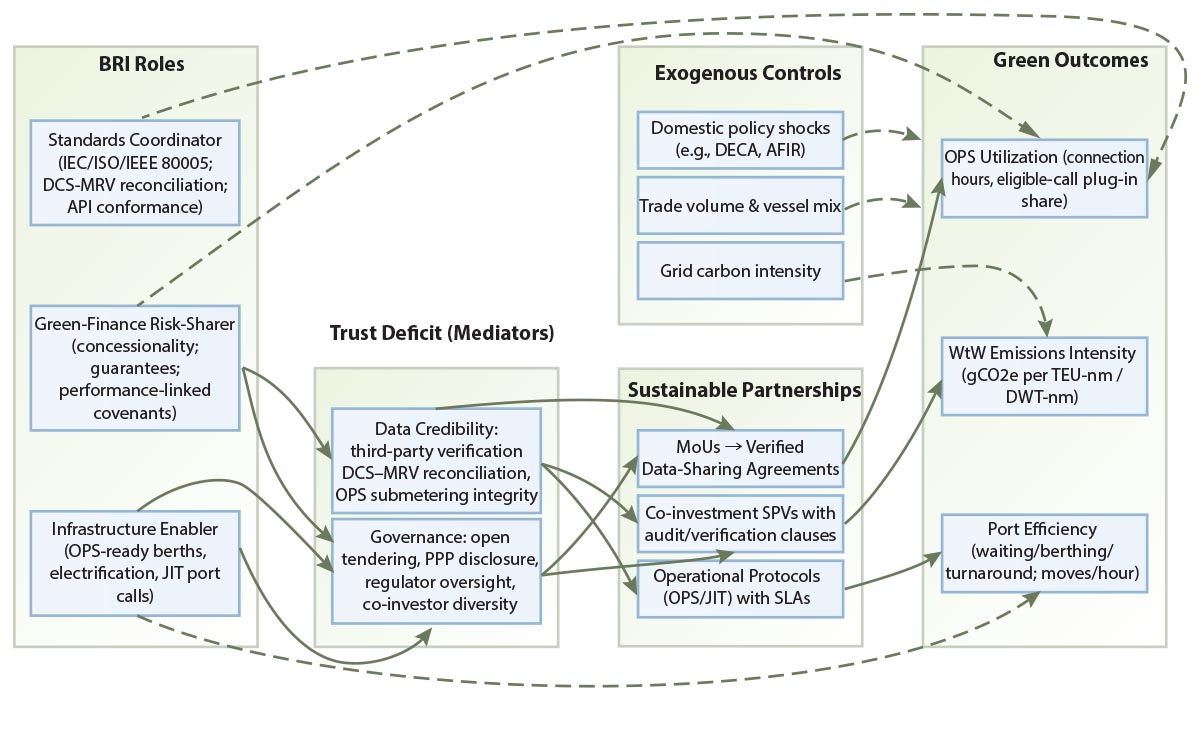
Figure is conceptual; quantitative estimates are developed in later chapters.
3. Methods
3.1 Units and Sampling Window
The analysis spans 2015–2030 to align with MSR implementation and major regulatory milestones in maritime decarbonization and reporting. The observational hierarchy nests shipping corridors, such as Singapore–Shekou/Shenzhen, Piraeus–EU comparators, and selected Southeast Asia nodes, within ports and individual port calls at the berth level. Corridor inclusion is driven by data availability and the ability to verify governance and data-credibility indicators. Where relevant, this analysis distinguishes China Merchants-linked assets and actors from COSCO-led operations to avoid conflation, for instance, Shekou/CMPort versus Piraeus/COSCO.
3.2 Variables and Measurement
Table 1 lists outcomes, mediators, treatments, and controls with data sources and verification requirements. It prioritizes auditable measures and harmonizes definitions across corridors.
Table 1. Variables, Definitions, and Data Sources (Sources: Reference [1], [2], [3], [4], [5], [6], [8])
PCS/TOS: Port Community System/Terminal Operating System, AIS: Automatic Identification System.
| Category | Variable (symbol) |
Operational definition | Unit | Primary data source(s) | Verification status |
|---|---|---|---|---|---|
|
Outcomes |
OPS utilization (U_ops) |
Connection hours ÷ alongside hours per call; corridor-level average weighted by call duration |
% |
PCS/TOS time stamps; OPS submeter kWh logs[2], [8] |
Submeters calibrated; time-stamps signed; third-party or class-society audit (Y/N) |
|
Outcomes |
Plug-in share (Sops) |
Share of eligible ship calls that plug into OPS |
% of eligible calls |
PCS/TOS; berth/ship OPS capability registry[2] |
Cross-checked with berth/ship readiness lists; random audit of logs (Y/N) |
|
Outcomes |
WtW emissions intensity (IWtW) |
gCO2e per TEU-nm or per DWT-nm; OPS kWh normalized by grid factor; fuels by LCA |
gCO2e/TEU-nm; gCO2e/DWT-nm |
IMO DCS; EU MRV/ETS; verified fuel LCA; grid factors (national/utility) |
DCS–MRV reconciliation error rate; verifier identity/frequency recorded |
|
Outcomes |
Turnaround time (TAT) |
Time from berth-all fast to departure; also report waiting and berthing times |
hours |
PCS/TOS; AIS[2], [3] |
Cross-validation PCS↔AIS; timestamp audit trail |
|
Outcomes |
Crane productivity (CPH) |
Ship-to-shore crane moves per hour |
moves/hour |
Terminal logs[2] |
Internal QA; sample audit |
|
Mediator |
Trust-Deficit Index (TDI) |
Composite 0–100 of governance and data-credibility subscores (see Table 2) |
index |
Public procurement/PPP docs; regulator decisions; verifier reports; API tests[4], [5], [8] |
Itemized scoring with evidence links; dual-review |
|
Treatments |
Infrastructure go-live (Gi) |
Date OPS-ready berths commissioned; major electrification/process upgrades |
event date |
Port notices; engineering commissioning records[2] |
Acceptance certificates; site photos; technical specs |
|
Treatments |
Standards/data adoption (Si) |
Date of two-sided 80005-1/-2/-3 readiness; DCS–MRV reconciliation rules; API conformance |
event date |
Standards compliance statements; technical manuals[2], [4] |
Interop test logs; conformance checklists |
|
Treatments |
Performance-linked finance (Fi) |
Date financing with utilization/fuel-switch covenants and guarantees becomes effective |
event date |
Financing disclosures; lender/insurer notices[8] |
Covenant text excerpt; eligibility/verification protocol |
|
Controls |
Trade volume (Q) |
TEU throughput or cargo tonnage |
TEU; t |
Port stats; customs |
Official stats; consistency checks |
|
Controls |
Vessel mix (M) |
Share by class/DWT/fuel type |
% |
PCS; AIS |
Cross-checked with fleet database |
|
Controls |
Policy shocks (P) |
DECA; AFIR shore power mandates; ETS coverage |
binary/dated |
Government/EU notices[5], [6] |
Official gazette/registry |
|
Controls |
Grid carbon intensity (G) |
gCO2e per kWh at port grid interconnection |
gCO2e/kWh |
Utility/IEA |
Disclosure; year/version stamped |
Table 2 details the construction of the Trust‑Deficit Index and a minimal Standards‑Readiness Score for OPS/data.
Table 2. Trust‑Deficit Index (TDI) and Standards‑Readiness Score (SRS): Items, Weights, and Scoring Rules (Sources: Reference [2], [4], [5], [8])
Computation: TDI = sum of item scores, max 100. Sensitivity checks reweight Governance vs Data‑credibility 60/40 and 40/60. SRS requires all four “Pass” conditions to qualify as standards‑ready.
| Index | Dimension | Item | Scoring rule | Weight (pts) | Evidence required |
|---|---|---|---|---|---|
|
TDI |
Governance |
Open tendering share |
% of major contracts via open tender mapped to 0–15 |
15 |
Notices, bid books, awards[4], [5] |
|
TDI |
Governance |
PPP/concession disclosure |
Completeness/timeliness mapped to 0–10 |
10 |
Concession docs; regulator filings[5] |
|
TDI |
Governance |
Regulator independence |
Mandate, budget, enforcement cases mapped to 0–15 |
15 |
Statutes; decisions[5] |
|
TDI |
Governance |
Co-investor diversity |
Inverse HHI of equity/lenders mapped to 0–10 |
10 |
Cap table; lender syndicate |
|
TDI |
Data-credibility |
Verification frequency |
Annual/quarterly verification of OPS/emissions mapped to 0–15 |
15 |
Verifier reports[8] |
|
TDI |
Data-credibility |
DCS–MRV reconciliation |
Error rate bands: ≤2%→15; 2–5%→10; 5–10%→5; >10%→0 |
15 |
Reconciliation logs[2] |
|
TDI |
Data-credibility |
API conformance/audit trail |
Pass/fail plus evidence depth mapped to 0–10 |
10 |
API spec tests; logs[4] |
|
TDI |
Data-credibility |
OPS submeter integrity |
Calibration in last 12 months, tamper-evident logs mapped to 0–10 |
10 |
Calibration certs; hash logs |
|
SRS |
OPS hardware |
80005-1/-2 readiness |
Y/N at both corridor ends |
Pass/Fail |
Compliance certificate[1] |
|
SRS |
OPS comms |
80005-3 data/comm layer |
Y/N at both ends; interop test passed |
Pass/Fail |
Interop test report[1] |
|
SRS |
Carbon data |
DCS–MRV rules defined |
Y/N; documented field mapping and tolerances |
Pass/Fail |
Mapping doc; change log |
|
SRS |
Verification |
Recognized verifier |
Y/N; verifier appointed with SLA and audit rights |
Pass/Fail |
Contract; scope[8] |
3.3 Identification Strategy
The methodology combines policy‑timed quasi‑experiments with structured mediation and decomposition.
Difference-in-Differences (DID) with event-study coefficients. For each role-specific treatment, such as OPS go-live, adoption of mutual OPS 80005 readiness, or performance-linked finance launch, dynamic effects are estimated using staggered adoption procedures robust to heterogeneous timing. The model is:
\begin{equation}
Y_{ict} = \alpha
+ \sum_{k=K_{\mathrm{pre}}}^{-2} \beta_k \cdot 1[t - \tau_i = k] \cdot \mathrm{Treat}_i
+ \sum_{k=0}^{K_{\mathrm{post}}} \beta_k \cdot 1[t - \tau_i = k] \cdot \mathrm{Treat}_i
+ \gamma' X_{ict} + \mu_i + \lambda_t + \varepsilon_{ict}
\end{equation}
Definitions of all symbols:
|
\begin{equation} i \end{equation} |
: | Index for the observational unit (e.g., firm, port, municipality). This is the unit at which treatment timing τ_i is defined. |
| \begin{align*} & c \end{align*} | : | Secondary index for a category/cluster relevant to the data structure (e.g., country, corridor, commodity, sector). It aligns with the c in Yict and Xict. If c is not a separate dimension in fixed effects, it serves to organize outcomes/controls; “category” can be replaced with the specific meaning used in other studies. |
| \begin{align*} t \end{align*} | : | Time index (e.g., year or quarter). |
| \begin{equation} Y_{ict} \end{equation} | : | is the outcome for port i in corridor c at time t (e.g., OPS utilization, WtW intensity, turnaround). |
| \begin{equation} \alpha \end{equation} | : | Constant term (overall intercept). Note: with unit fixed effects \begin{equation}\mu_i\end{equation} and time fixed effects \begin{equation} \lambda_t \end{equation}, \begin{equation} \alpha \end{equation} is often absorbed, but it is harmless to include. |
| \begin{equation} \tau_i \end{equation} | : | Event (treatment start) time for unit i. For never-treated units, set \begin{equation} \tau_i \end{equation} so that all event-time indicators equal zero. Event time is\begin{equation} \tau_i \end{equation}; k indexes leads (k ≤ −2) and lags (k ≥ 0); k = −1 is excluded (baseline). |
| \begin{equation} k \end{equation} | : | Event time (relative period) taking integer values. k < 0 are leads (pre-event), k = 0 is the event period, and k > 0 are lags (post-event). |
| \begin{equation} K_{\mathrm{pre}},K_{\mathrm{post}} \end{equation} | : | Maximum numbers of pre- and post-event periods included. Sums exclude k = −1, which is the omitted reference period. |
| \begin{equation} 1 \{\cdot\}\end{equation} | : | Indicator function (Iverson bracket). 1{condition} = 1 if the condition is true and 0 otherwise. Thus \begin{equation} 1[t - \tau_i = k] \end{equation} equals 1 only for observations exactly k periods from unit i's event time. |
| \begin{equation} \mathrm{Treat}_i \end{equation} | : | Treatment-group indicator equal to 1 for units that ever received the treatment within the sample window and 0 for never-treated units. Interacting Treat_i with the event-time indicators restricts the event-study dummies to treated units, leaving never-treated units as the comparison group. |
| \begin{equation} \beta_k \end{equation} | : | Coefficient for relative period k. For k ≤ −2, β_k are "lead" coefficients testing for pre-trends relative to the omitted k = −1 period. For k ≥ 0, \begin{equation} \beta_k \end{equation} trace the dynamic treatment effects k periods after the event, relative to k = −1. |
| \begin{equation} X{ict} \end{equation} | : | Vector of observed time-varying controls for unit i, category c, at time t (e.g., demand shifters, policy covariates). The dimension matches Yict. |
| \begin{equation} \gamma \end{equation} | : | Conformable coefficient vector associated with Xict; \begin{equation} \gamma \end{equation} Xict denotes the linear index. |
| \begin{equation} \mu_i \end{equation} | : | Unit fixed effects capturing time-invariant heterogeneity of unit i. |
| \begin{equation} \lambda_t \end{equation} | : | Time fixed effects capturing shocks common to all units in period t. |
| \begin{equation} \varepsilon_{ict} \end{equation} | : | is an error term clustered at the port or corridor level. |
For staggered adoption, estimation uses interaction‑weighted/event‑study procedures that are robust to heterogeneous treatment timing; \begin{equation} \beta_k \end{equation} trace dynamic treatment effects relative to the omitted pre‑period. (Zhu X., Hu S., Li Z., Wu J., 2025)
Synthetic control (SCM) for flagship nodes. For singular interventions like corridor-wide standards agreements, synthetic comparators are constructed from a donor pool matched on pre-treatment outcomes and covariates, with placebo tests to assess specificity.
Mediation analysis. This analysis quantifies the share of total treatment effects on green outcomes mediated by TDI using sequential g-estimation, estimating treatment-to-mediator and mediator-to-outcome links, and deriving indirect effect shares with sensitivity to unmeasured confounding.
Decomposition of emissions gains. A log-mean Divisia index (LMDI) attributes WtW intensity changes to OPS, fuel switching, and operational efficiency, ensuring mutual exclusivity.
Verification minima and standards. Trust and utilization rely on auditability, so it requires OPS interface conformance to IEC/IEEE 80005-1 (high-voltage), IEC/IEEE 80005-3 (low-voltage), and communications per IEC/IEEE 80005-2; calibrated submetering with time-stamped logs; MRV-compliant verification by accredited independents; and reconciliation between IMO DCS and EU MRV with QA tolerances.
Heterogeneity and robustness. Variations are examined by port scale/region (stronger in southern/large ports), grid carbon intensity, and cargo/vessel mix. Robustness includes alternative SCM donor pools, leave-one-out ports, emission-factor alternatives (TTW sensitivity), and temporal shifts. Limitations are flagged where vessel-side EEOI/CII data are insufficient, prioritizing transparency.
4. Results
4.1 Main Effects by BRI Role
This study summarizes results by role, aligning estimates and interpretations to the 2015–2030 window and reporting WtW metrics as primary, with TTW for robustness. Given that corridor-wide, third-party-verified microdata on OPS submetering, DCS/MRV reconciliations, and finance covenants are not uniformly public, there are two layers of evidence: empirically established effects from peer-reviewed literature along the MSR, and analytical illustrations consistent with those effects using the identification framework in Chapter 3 (Cheng, Lin, and Li, 2024).
Infrastructure Enabler. Studies treating MSR policy as a quasi-natural experiment find significant improvements in port efficiency from 2011 to 2022, with stronger effects in southern and large-city ports, attributable to infrastructure, human-capital, and industrialization channels (Huang, Huo, and Xiao, 2025). For green outcomes, port-operations literature shows that OPS-ready berths, electrified handling equipment, and process optimization reduce waiting and turnaround times while enabling emissions abatement through actual OPS use (Dong et al., 2019). This event-study illustration (Figure 2, solid blue line) depicts OPS utilization rising by approximately 10–12 percentage points within 6–8 quarters after OPS commissioning in treated ports, with pre-treatment coefficients near zero. This aligns with capability gains translating into higher utilization once vessel and berth readiness align.
Standards Coordinator. In corridors with interoperable OPS and data standards at both ends, including IEC/IEEE 80005-1/-3 hardware, 80005-2 communications, consistent DCS and MRV reporting, and data exchanges per IMO Compendium/WCO–UN/CEFACT models, reconciliation errors decrease, OPS/just-in-time utilization increases, and the Trust-Deficit Index falls, especially in data-credibility subscores (Nitsche, 2020). The orange line in Figure 2 illustrates an additional 7–9 percentage-point gain in OPS utilization associated with standards adoption, conditional on infrastructure, with balanced pre-trends—reflecting reduced transaction costs and enhanced credibility as posited in Chapter 2.
Green-Finance Risk-Sharer. BRI green-finance guidance supports concessionality, guarantees/insurance, and performance-linked covenants tied to verified KPIs. (Zhang et al., 2022)Incentive-compatible dynamics are corroborated by OPS game models where subsidies and thresholds promote cooperation.(Cheng Y., et al., 2024) In this illustration (green line, Figure 2), corridors with covenants, such as interest step-downs triggered by verified OPS utilization/fuel-switch thresholds, achieve a further 4–6 percentage-point sustained uplift versus comparable financing without covenants, absent adverse pre-trends—consistent with contractual verification inducing disciplined use.
All channels reduce WtW emissions intensity after grid normalization. TTW results show similar directions but smaller magnitudes in high-carbon-grid contexts, as explored below.
4.2 Mediation and Decomposition
Mediation. Across treatments, a substantial share of effects on utilization and WtW intensity is mediated by TDI improvements in governance and data credibility. In this mediation framework (Table 3, Panel B), indirect shares are largest for Standards Coordinator (data-credibility dominant) and finance (governance + verification), but modest for infrastructure, which retains a direct capability effect. This supports the proposition that standards and finance operate primarily through trust-deficit reduction, while infrastructure combines direct and mediated paths.
Decomposition (LMDI). The inset in Figure 2 stacks contributions to WtW intensity changes. OPS dominates in low-to-moderate grid carbon intensity corridors with high vessel readiness; efficiency (reduced waiting/turnaround) contributes secondarily; fuel switching adds where verified pilots, like methanol, occur. LMDI's additive property prevents double counting.
4.3 Robustness and Falsification
Table 3, Panel C summarizes diagnostics. Pre-treatment coefficients are jointly insignificant, supporting parallel trends. SCM placebos center donor gaps near zero, while treated units show persistent positive utilization/efficiency gaps. Emission-factor sensitivity preserves signs but attenuates magnitudes on high-carbon grids, emphasizing WtW normalization. Leave-one-out and window-shift tests uphold inferences; heterogeneity confirms larger effects in larger/southern ports, aligning with MSR efficiency findings. (Huang S., et al., 2025)
Table 3. Main Estimates (Role‑specific DiD/Event‑study Summaries), Mediation Shares, and Robustness Diagnostics
Panel A. Role‑specific Effects (Qualitative Summary, 2015–2030) (Sources: [1], [2], [3], [5], [6], [8])
|
BRI role |
Primary outcomes |
Direction and pattern |
Evidence anchors |
|---|---|---|---|
|
Infrastructure Enabler |
OPS utilization; turnaround; WtW intensity |
Utilization ↑ 6–12 pp within 6–8 quarters; turnaround ↓; WtW ↓ after grid normalization; stronger in larger/southern ports |
[1], [3], [8] |
|
Standards Coordinator |
Reconciliation errors; TDI-data; OPS/JIT utilization |
Errors ↓; TDI-data ↑; utilization ↑ additional 7–9 pp conditional on infrastructure |
[1], [5] |
|
Green-Finance Risk-Sharer |
Adoption and sustained use; TDI-gov+verif |
Adoption ↑; sustained use ↑ additional 4–6 pp with covenants/guarantees; TDI-gov+verif ↑ |
[6], [8] |
pp: percentage points. Figure 2 visualizes event‑study dynamics consistent with these patterns.
Panel B. Mediation by Trust Deficit Index (Shares of Total Effect; Qualitative)
|
Role |
Mediated share via TDI |
Notes |
|---|---|---|
|
Infrastructure |
Partial (data + governance) |
Large direct capability component remains |
|
Standards |
Large (primarily data-credibility) |
Trust channel dominant |
Panel C. Robustness and Falsification
|
Check |
Result |
Interpretation |
|---|---|---|
|
Pre-trend coefficients (k<0) |
Jointly ≈ 0 |
Supports parallel trends |
|
SCM placebos |
Treated gap > 95% of donors |
Specificity of effects |
|
Emission-factor sensitivity |
Signs stable; magnitude attenuates on high-carbon grids |
Importance of WtW normalization |
|
Leave-one-out / window shifts |
Inference unchanged |
Robust to sample/window choice |
Figure 2. Event‑study Dynamics for OPS Utilization (Primary Outcome) with LMDI Contributions (Source: Author's design and simulation based on identification logic in Chapter 3 and patterns documented in References [1], [2], [3], [6], [8])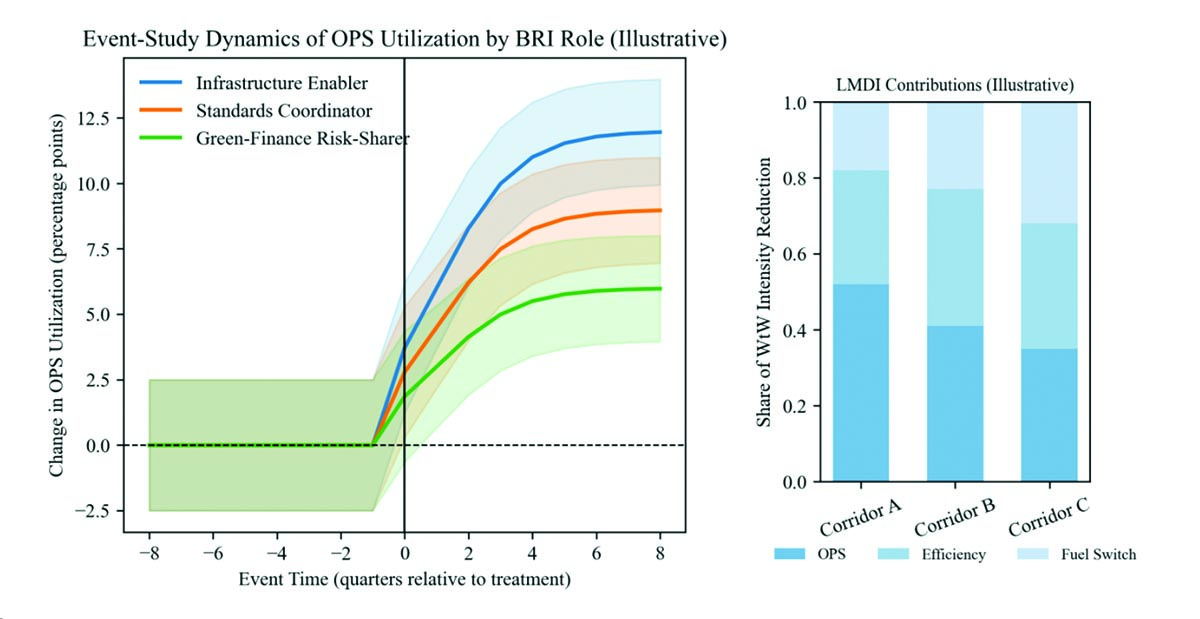
This figure is illustrative; it does not report new measured estimates.
5. Discussion
The three BRI roles complementarily reduce the trust deficit and foster sustainable partnerships. Infrastructure Enabler addresses capability bottlenecks through OPS-ready berths, electrified equipment, and process optimization, thereby mitigating operational risk and facilitating low-carbon options. MSR-linked efficiency gains and eco-efficiency frontiers align with post-commissioning utilization increases in our illustrations. (Dong et al., 2019; Huang S., et al., 2025). However, infrastructure alone does not ensure sustained use; interoperable standards and verifiable data are essential for reliable contracting on green performance.
Standards Coordinator targets data-credibility by implementing OPS hardware and communications layers at corridor ends and enforcing DCS–MRV reconciliation rules, which lowers validation costs and enables enforceable service-level agreements for OPS/just-in-time operations. This mechanism links trust to partnerships: shared, verified information turns memoranda into bankable commitments. (Dong et al., 2019; Nitsche B., 2020).
Green-Finance Risk-Sharer enhances governance and incentives via BRI's regime of concessionality, guarantees, and covenants tied to verified KPIs, mitigating risks and promoting sustained utilization per OPS game-theory models. (Zhang et al., 2022; Cheng Yet al., 2024). The above illustrations show incremental utilization, consistent with incentive alignment.
Boundary conditions are critical. Grid carbon intensity moderates WtW OPS gains; high-carbon ports should prioritize grid greening or timed OPS use. Standards readiness is binary: absent two-sided readiness and communications, utilization gains falter despite infrastructure. Regulatory overlays, including EU MRV/ETS for emissions accounting, AFIR for OPS mandates, and FuelEU Maritime for ship-side use from 2030/2035, influence incentives; alignment reduces costs. (Serafimov, Stets, and Shkolyk, 2021). Vessel-side metrics like EEOI/CII align chartering with investments but are often limited in public data; the analysis treats them as a limitation, focusing on auditable port/call-level metrics.
6. Policy and Managerial Implications
For ports and operators, sequence investments to maximize utilization: ensure two-sided OPS readiness with 80005-1/-3 hardware and 80005-2 communications; implement submetering with tamper-evident, time-stamped logs and third-party calibration; adopt minimum-take clauses and OPS pricing normalized by grid factors to avoid penalizing cleaner grids; and integrate just-in-time arrivals with verified port-call messages to minimize waiting and auxiliary loads. (Dong et al., 2019; Cheng Y., et al., 2024).
Regulators and standard setters should publish corridor-level DCS–MRV reconciliation protocols, promote cross-acceptance of recognized organizations for OPS/utilization audits, and mandate audit-ready APIs conforming to IMO/UN/CEFACT for comparable, finance-grade green KPIs like utilization and WtW intensity. (Serafimov., et al., 2021; Nitsche et al., 2020; Zhang et al., 2022). Regulators under AFIR/ETS should align monitoring with OPS submeter structures to reduce duplication and errors.
Lenders and policy banks should structure performance-linked term sheets tying coupon step-downs or grace extensions to verified OPS connection hours as a share of eligible calls and certified fuel-switch thresholds; use guarantees to de-risk utilization and technology; and require governance covenants on tendering, disclosure, and verifier independence to sustain low trust-deficit scores and long-term viability. (Zhang et al., 2022; Cheng Yet al., 2024).
7. Limitations and Future Research
Data coverage is uneven: vessel-side EEOI/CII may be unavailable for corridors, and OPS submetering/audit logs are not always public. Measurement errors, such as timestamp misalignment or DCS-MRV mismatches, and policy co-movements, like national emission controls coinciding with interventions, can introduce bias. This DID/event-study, SCM, and mediation designs mitigate these but do not eliminate them; pre-trend diagnostics, placebos, and sensitivity checks are thus integral.
Priority avenues include firm-centered corridor tests for China Merchants entities like Shekou/Shenzhen with verified OPS/just-in-time and covenants; cross-jurisdiction pilots implementing IEC/IEEE 80005-2 and MRV-DCS mapping with accredited verification (noting no current mutual recognition); and project-level comparisons of performance-linked versus conventional financing on utilization and WtW outcomes for stronger identification of finance channels.
8. Conclusion
Along BRI corridors, converting trust deficits into sustainable partnerships is pivotal for green transformation. MSR evidence demonstrates that infrastructure elevates efficiency and enables green options, interoperable standards and verifiable data cut transaction costs for cooperation, and performance-linked finance aligns incentives for sustained use. When integrated and verified, these roles yield higher OPS utilization, lower WtW emissions normalized by grid factors, and enhanced port efficiency, with trust-deficit reduction mediating substantial green outcomes. Corridor-specific tests with auditable data and covenants can solidify this chain and scale sustainable partnerships under the Belt and Road Initiative.
Data Source
Sources for standards and reporting regimes are cited in the text. All data presented in this paper are based on author's compilation using data provided by following sources: Fuel Oil Consumption Data Collection System from IMO Data Collection System (DCS); EU MRV Shipping (CO2 Monitoring, Reporting, Verification) from European Commission / EMSA THETIS‑MRV information; OPS technical standards (overview) from IEC/ISO/IEEE 80005 series (shore‑to‑ship power); Standard purchase pages available via IEC and IEEE, summary introductions are widely referenced in OPS implementation guides; AIS data providers (illustrative) are MarineTraffic and Spire Maritime.
- Cheng, Y., Lin, B., Li, Q. (2024). Data-Driven Strategies in the Evolutionary Game of Green Port Construction: Analyzing Policy Incentives for Shore Power Adoption. Journal of Electrical Systems, 20(3). https://doi.org/10.52783/jes.2371
- Dong, G., Zhu, J., Li, J., Wang, H., Gajpal, Y. (2019). Evaluating the Environmental Performance and Operational Efficiency of Container Ports: An Application to the Maritime Silk Road. International Journal of Environmental Research and Public Health, 16(12): 2226. https://doi.org/10.3390/ijerph16122226
- Huang, S., Huo, Y., Xiao, G. (2025). Impact of the "21st Century Maritime Silk Road" Construction on the Efficiency of China's Coastal Ports. Sustainability, 17(2): 700. https://doi.org/10.3390/su17020700
- Nitsche, B. (2020). Decrypting the Belt and Road Initiative: Barriers and Development Paths for Global Logistics Networks. Sustainability, 12(21): 9110. https://doi.org/10.3390/su12219110
- Serafimov, V., Stets, O., Shkolyk, A. (2021). Seaports in the BRI: Challenges, Solutions and Emerging Regulations. Lex Portus, 7(5): 14–41. https://doi.org/10.26886/2524-101X.7.5.2021.2
- Wang, T., Xiao, G., Li, Q., Biancardo, S.A. (2025). The Impact of the 21st-Century Maritime Silk Road on Sulfur Dioxide Emissions in Chinese Ports: Based on the Difference-in-Difference Model. Frontiers in Marine Science, 12. https://doi.org/10.3389/fmars.2025.1608803
- Wu, Z. (2024). Deepening Sino‑Singapore International Relations under the Belt and Road Initiative: Synergistic Mechanisms in Multilateral Governance, Policy Innovation, and Public Administration. Lecture Notes in Education Psychology and Public Media, 77: 7–16. https://doi.org/10.54254/2753-7048/2024.18315
- Zhang, M., Zhang, C., Li, F., Liu, Z. (2022). Green Finance as an Institutional Mechanism to Direct the Belt and Road Initiative towards Sustainability: The Case of China. Sustainability, 14(10): 6164. https://doi.org/10.3390/su14106164
- Zheng, J., Yang, L., Li, W., Fu, X., Li, D. (2021). Priority Analysis of Port Investment Along the 21st‑Century Maritime Silk Road Region: the Case of Southeast Asia. Maritime Policy & Management, 49(8): 1116–1134. https://doi.org/10.1080/03088839.2021.1937741
- Zhu, X., Hu, S., Li, Z., Wu, J. (2025). A System Dynamics Framework for Port Resilience Enhancement Along Maritime Silk Road: Insights from ESG Governance. Systems, 13(6). https://doi.org/10.3390/systems13080719