Global Shipping Capacity Evolution 1950–2025: A Descriptive Overview with Industry Perspectives
CHEN Muxin, CHEN Yang Affiliations & Notes
CHEN Muxin: Bachelor, School of Maritime Economics and Management, Dalian Maritime University, Dalian 116026, China. CHEN Yang: Chief Editor of Xinde Marine News, Dalian 116026, China. (Correspondence)
Over the past 75 years, global fleet capacity has experienced unprecedented rapid expansion, experiencing sustained, multi-decade expansion while exhibiting distinct cyclical development characteristics. Based on authoritative data sources including UNCTAD and Clarksons Research, this paper analyzes the evolution of global shipping capacity from 1950–2025 through historical development trajectories. Regarding regional capacity distribution, the analysis examines the historic shift from European-American dominance to Asian prominence. The global shipping industry is currently undergoing profound transformation, with stricter environmental regulations, accelerated digital transformation, and rising geopolitical risks reshaping industry dynamics. Future shipping development will increasingly focus on quality and efficiency, with the green low-carbon transition becoming a defining priority. Looking ahead five years, global shipping capacity will exhibit characteristics of rational growth, structural optimization, and green transformation. This study provides comprehensive historical insights and forward-looking perspectives for shipping industry decision-makers, offering valuable reference for understanding global shipping capacity development patterns and trends.
Keywords :
Shipping Capacity Evolution; Historical Evolution; Regional Capacity Distribution
1. Introduction
Examining the development trajectory of the global shipping industry reveals how this sector has become the lifeline of global trade. The transformation of the shipping industry represents not merely growth in tonnage figures, but a microcosm of evolving global economic patterns. Capacity relates not only to the scale of global trade but serves as a crucial indicator for observing industry development. Each capacity change reflects the development pace of the shipping industry and even the global economy.
From the golden age of post-war reconstruction to structural adjustments during oil crises, from steady recovery amid globalization waves to the super-cycle of China's rise, and to exploration of new normal conditions following financial crises, the transformation trajectory of shipping capacity clearly outlines the major stages of global economic development.
Based on authoritative data sources including the United Nations Conference on Trade and Development (UNCTAD), Lloyd's Register Foundation (LRF), and Clarksons Research Services (CRS), this paper systematically analyzes the historical evolution of global shipping capacity, revealing underlying driving factors and future trends (historical statistics follow the original measurement conventions in place at the time [e.g., GRT prior to the GT transition]; no back-conversion is attempted).
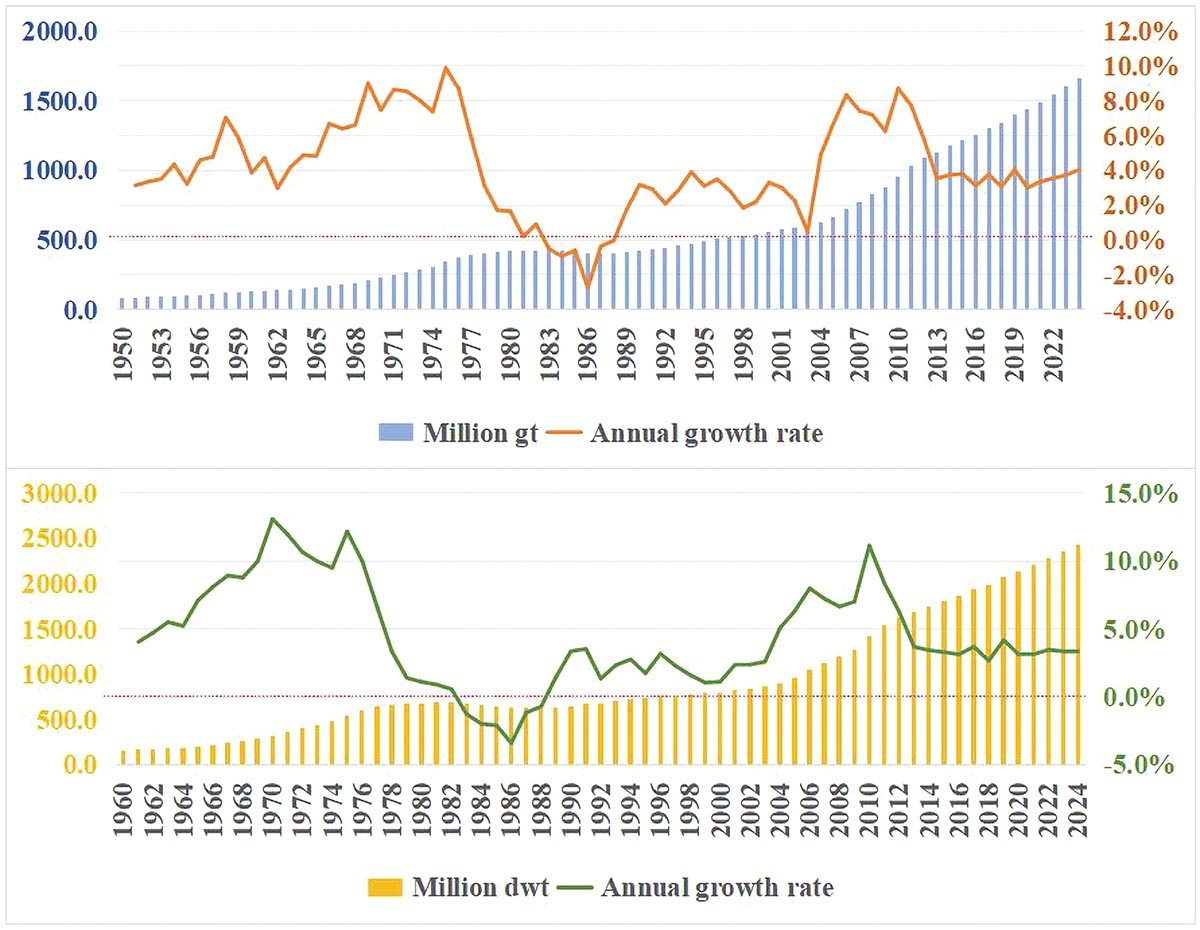
Figure 1. Global Fleet Total Capacity Development Trends (1950–2025)
2. Global Capacity Evolution Timeline
2.1 Golden Age (1950–1973): Post-war Prosperity and Technological Revolution
Following World War II, the global shipping industry entered an unprecedented golden age. Capacity growth during this period demonstrated steady yet robust momentum. Data shows global fleet total tonnage was merely 84.58 million gross tons in 1950, soaring to 289 million gross tons by 1973—a 2.4-fold increase over 23 years with an average annual growth rate of 5.52%.
The most significant characteristic of this period was the simultaneous occurrence of three major technological revolutions: containerization revolution completely transformed cargo transportation methods, bulk cargo transport improved bulk commodity transportation efficiency, and vessel specialization promoted refined development of different ship types. These three revolutions not only enhanced transportation efficiency but, more importantly, laid the technological foundation for subsequent decades of capacity expansion.
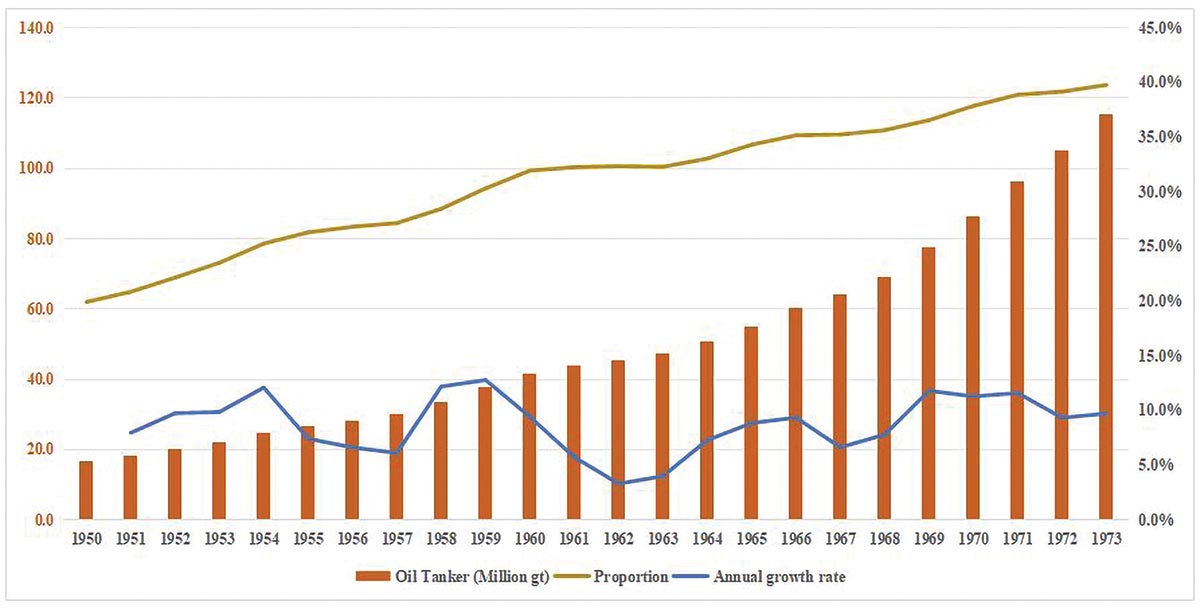
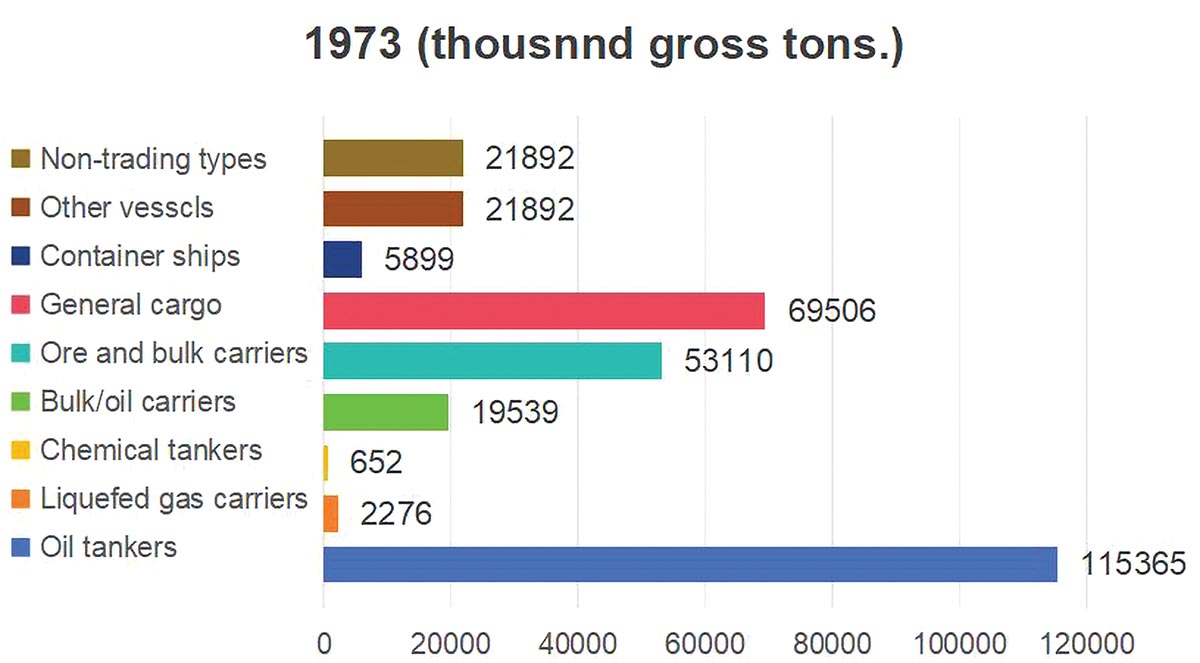
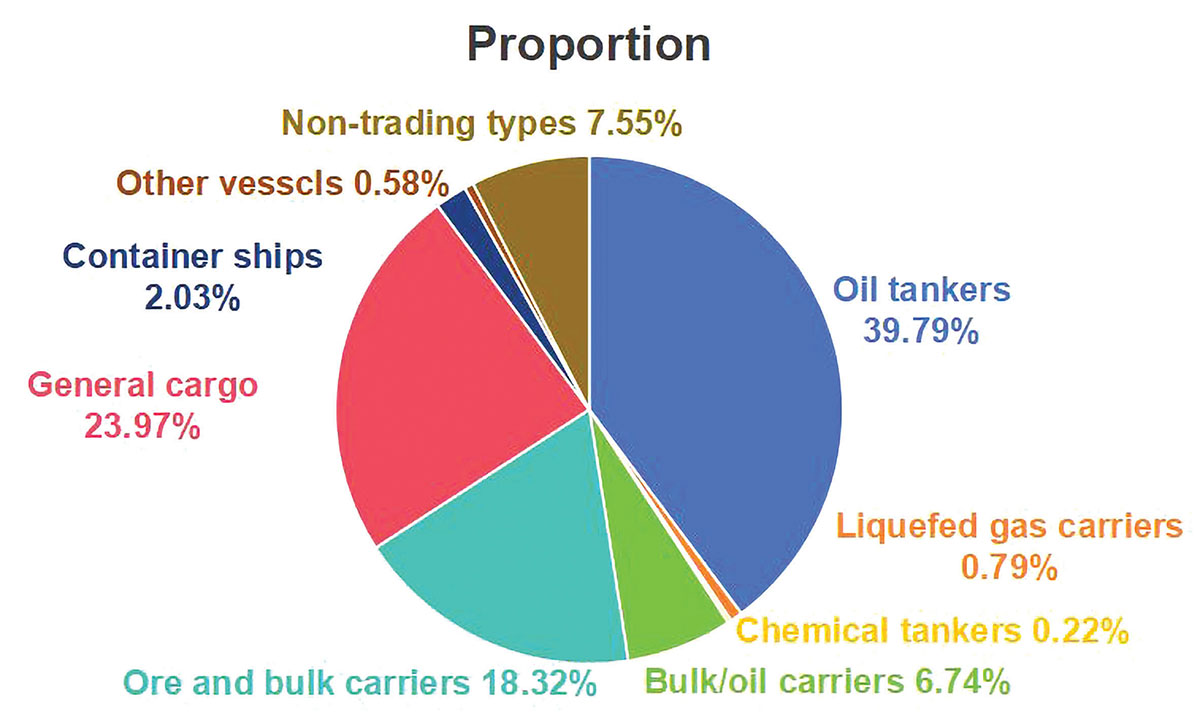
During this period, global trade volumes grew rapidly, with explosive growth in oil trade becoming the primary driver of global fleet expansion. In 1950, the global tanker fleet totaled 16.866 million gross tons, approximately 20% of total capacity (depending on the baseline used). By 1973, tanker tonnage reached 115.366 million gross tons, approaching 40%.
Figure 2. Global Tanker Fleet Capacity Growth (1950–1973)
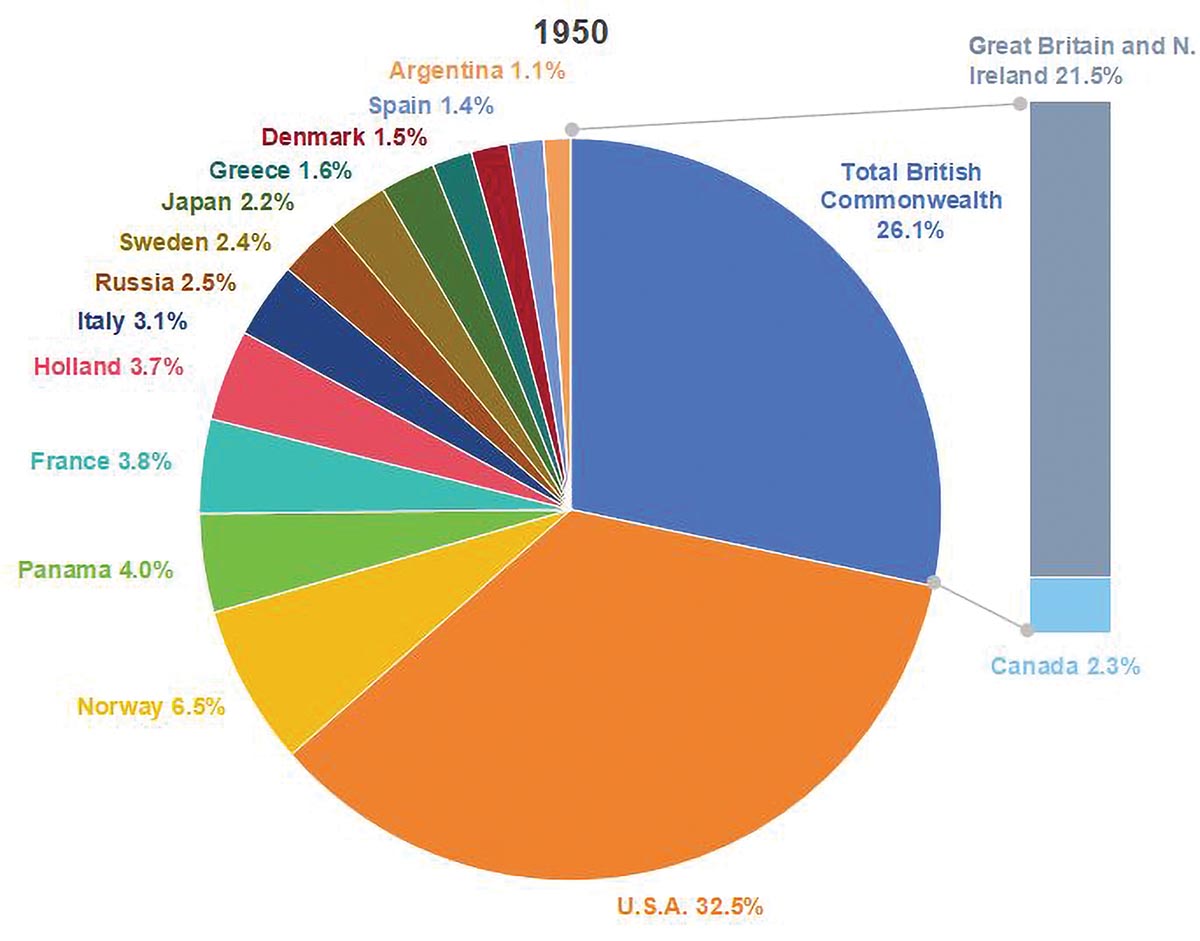
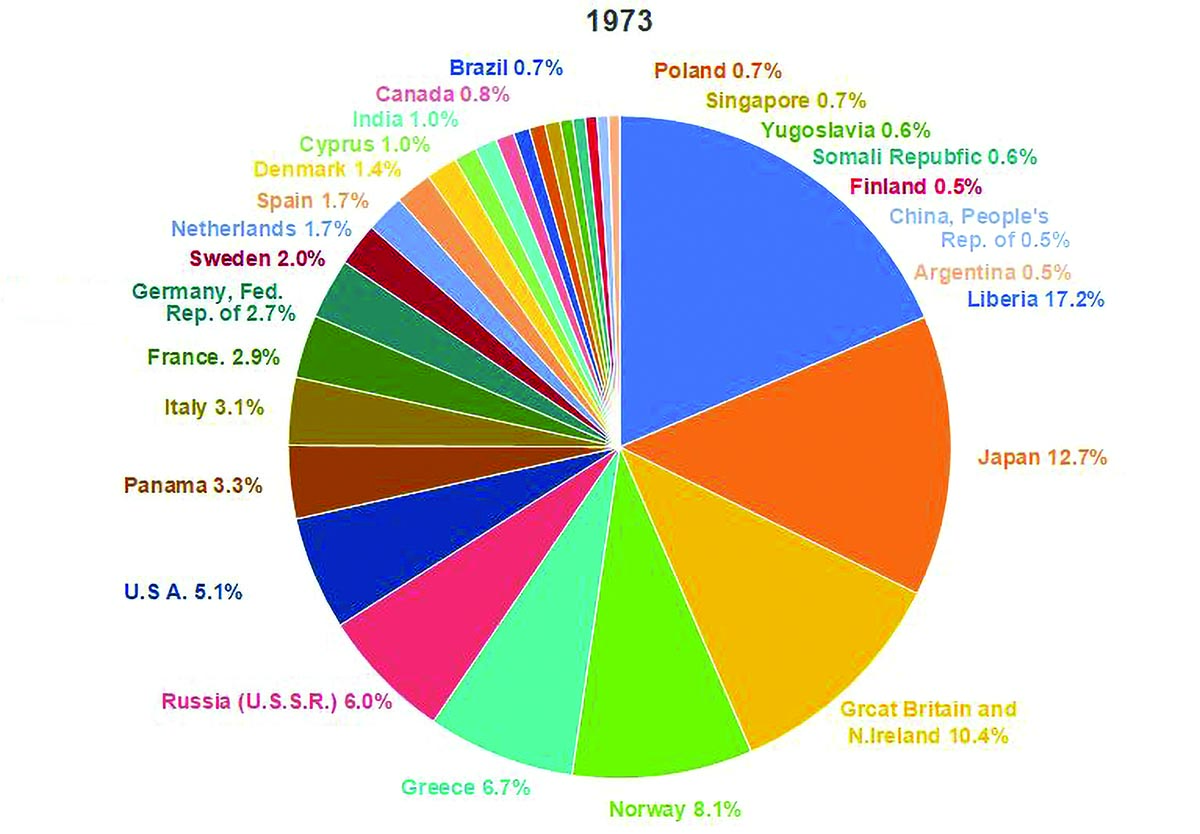
Capacity expansion during this phase was primarily dominated by Western developed economies. The United States, United Kingdom, Norway, Greece, and Japan controlled most global capacity. Notably, the rise of flags of convenience (such as Liberia and Panama) began during this period, establishing the foundation for subsequent global fleet registration patterns.
Figures 3 & 4. Major Countries' Capacity Growth in 1950 and 1973
2.1.1 Technological Revolution: Containerization and Vessel Enlargement
The 1960s witnessed containerized transport completely revolutionize the global shipping industry. Containerization began in the late 1950s; a commonly cited milestone is the 1956 inaugural voyage associated with the advent of modern container shipping. We therefore treat the late 1950s–1970s as the diffusion window. By 1973, the global container fleet reached 5,898,763 gross tons, with average container ship size increasing to 14,970 gross tons. Containerization dramatically improved loading/unloading efficiency, reduced transportation costs, and created conditions for further global trade expansion. Simultaneously, vessel enlargement trends became increasingly evident, particularly the tanker.
Figures 5 & 6. Major Ship Types' Capacity and Proportions in 1973
2.2 Adjustment and Restructuring (1974–1989): Oil Crisis and Overcapacity
The outbreak of the Fourth Middle East War in October 1973 triggered massive waves in the global shipping industry. The Arab oil embargo declaration quadrupled international oil prices in the short term, ending the shipping industry's 20-year golden age and initiating a new era of turbulence and restructuring.
2.2.1 Oil Price Shock Ripple Effects
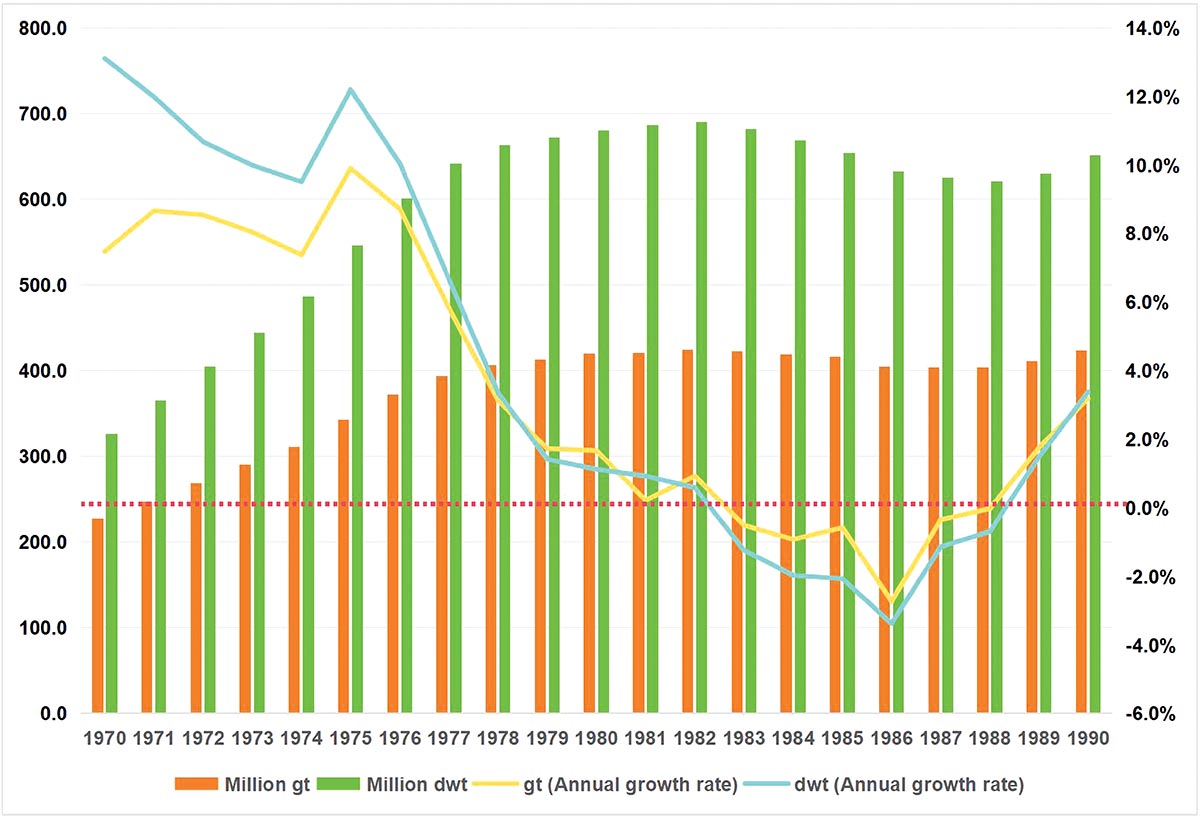
Oil price surges produced dual effects: direct impact manifested in sharply rising operating costs, while indirect effects were more profound—fundamental changes in global economic growth models reshaped maritime demand structure. Data shows that during 1974–1989, global fleet capacity fluctuated from 311.3 million gross tons to 410.5 million gross tons. By mid-1983, world merchant fleet gross tonnage was approximately 422.6 million, and total deadweight tonnage was approximately 681.6 million.
Figure 7. Global Shipping Capacity Changes (1974–1989)
2.2.2 Overcapacity and Market Adjustment
Due to timing mismatches, severe overcapacity persisted from the mid-1970s to late 1980s. Large numbers of new ships delivered during 1974–1978 (especially tankers) created serious supply-demand imbalances amid shrinking market demand. Global fleet overcapacity peaked in 1982–1983, with idle capacity rates reaching 15%. During this period, numerous tankers were idled or scrapped, and ship market prices plummeted.
This overcapacity was not short-term pain but persisted for nearly a decade. Facing severe conditions, the shipping industry underwent difficult adjustments, exhibiting two distinct characteristics: increased ship scrapping, with global scrapping volumes reaching a historic peak of 43 million deadweight tons in 1985; and reduced new ship orders, with global shipbuilding capacity utilization below 50% during 1980–1988, forcing many shipyards to halt operations or close.
In 1987, global shipping markets bottomed out, with the Baltic Dry Index (BDI) falling to historic lows. The crisis prompted deep industry adjustments: numerous old, inefficient vessels were forced from markets, while surviving companies focused on refined management and cost control. Simultaneously, oil crises accelerated global energy structure adjustments and trade pattern changes—European and American countries reduced Middle East oil dependence, decreasing long-distance oil transport demand; manufacturing transfer to Asia became evident, laying groundwork for subsequent Asian shipping rise and globalization waves.
2.3 Globalization Acceleration (1990–2008): Asian Rise and Capacity Explosion
The end of the Cold War in early 1990 opened a new development era for the shipping industry. This historical turning point's significance lay not only in eliminating ideological barriers but, more importantly, in releasing globalization potential suppressed for decades. The shipping industry climbed from lows, exhibiting different development characteristics from previous periods.
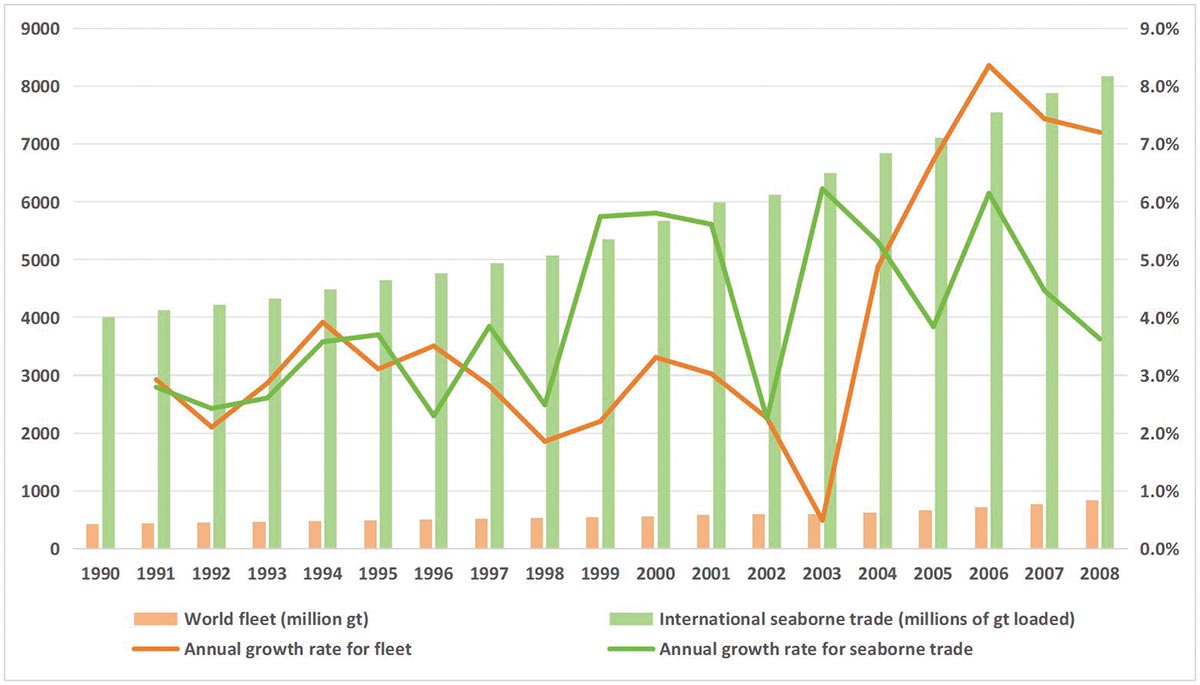
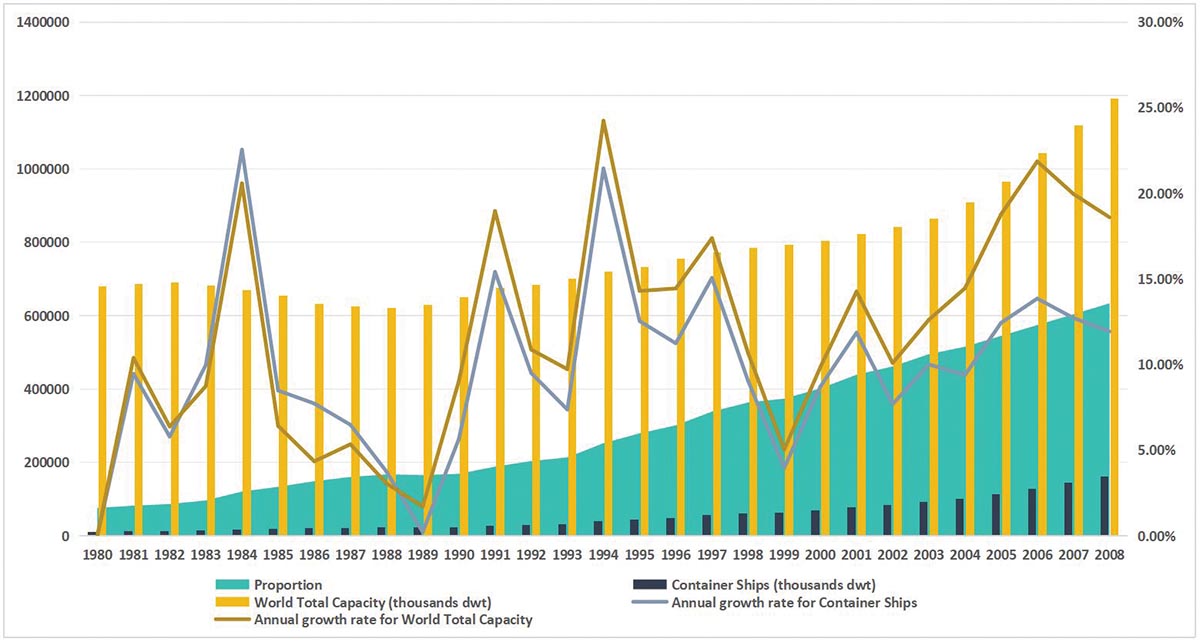
During 1989–1995, global fleet annual growth rates were controlled at 2–3%, representing rational growth contrasting sharply with previous explosive expansion. Maritime trade prosperity began in the mid-1990s. Global maritime trade volumes surged from 4 billion tons in 1990 to 8.2 billion tons in 2008, with an average annual growth rate of 4.2%. This growth rate not only exceeded concurrent global GDP growth but, more importantly, provided unprecedented development opportunities for the shipping industry through its continuity and stability.
Driven by trade growth, global fleet scale expanded rapidly. Global merchant fleet capacity grew from 630 million deadweight tons in 1990 to 1.12 billion deadweight tons in 2008, increasing 77%. Container fleet capacity growth was most rapid.
Figure 8. Global Maritime Trade Volumes vs. Fleet Capacity Comparison (1990–2008)
During this period, global fleet structure underwent profound changes, with containerized transport becoming the dominant mode of global trade. Container fleet capacity's share of global fleet increased from 3.63% in 1990 to about 14% in 2008 (across sources the estimate varies by roughly ±1 percentage point), growing from 23.6 million deadweight tons to 162 million deadweight tons—a 5.86-fold increase. Bulk carrier fleet scale also expanded significantly, from 220 million deadweight tons in 1990 to 390 million deadweight tons in 2008, while tanker fleet proportion decreased from 37% in 1990 to 34% in 2008.
Figure 9. Global Container Fleet Capacity Growth (1990–2008)
2.3.1 Asian Rise: Opening of the Pacific Era
The most significant change during this period was the rise of Asian maritime forces, particularly China, South Korea, and Singapore. During the 1980s-1990s, South Korea, Taiwan, Hong Kong, and Singapore achieved economic takeoff through export-oriented development strategies, establishing foundations for Asian shipping rise.
China's rise was the most important variable during this period. From a marginal participant in 1990 to core driving force in 2008, China completed a historic leap in just 18 years:
- Shipowner strength advancement: Chinese shipowner-controlled capacity increased from 22 million deadweight tons in 1990 to 103 million deadweight tons in 2008, ranking fourth globally.
- Shipbuilding capacity explosion: Chinese shipbuilding completions increased from less than 1 million deadweight tons in 1990 to 18.8 million deadweight tons in 2008, forming a tripod with Japan and South Korea.
- Port status elevation: Shanghai Port container throughput increased from 450,000 TEU in 1990 to 27.9 million TEU in 2008, ranking second globally.
Explosive growth in intra-Asia trade and trans-Pacific trade rewrote the global trade map: during 1987–1997, intra-Asia trade increased threefold, trans-Pacific trade increased 2.5-fold; Asian ports' container throughput accounted for 62% globally in 2007, compared to 38% in 1990; traditional "Atlantic trade circles" yielded to "Pacific trade circles," achieving historic eastward migration of shipping centers.
Simultaneously, traditional shipping center patterns quietly changed. Asian ports like Hong Kong, Singapore, and Shanghai surpassed European traditional ports like Rotterdam and Hamburg, joining the world's busiest container ports.
2.4 Post-Financial Crisis New Normal (2009–2019): Overcapacity Dilemma and Structural Adjustment
The 2008 global financial crisis marked the shipping industry's entry into a painful yet profound adjustment period. This phase was characterized by severe supply-demand imbalances, large-scale industry consolidation, and green transition initiation.
2.4.1 Supply-Demand Imbalance Financial Tsunami
Subprime market crises rapidly spread globally, causing international trade to contract sharply, leading to sudden maritime demand reduction and market contraction. In 2009, global maritime trade volumes experienced negative growth, declining 4.5%. Beyond demand-side cliff drops, supply-side inertial releases occurred. Due to shipbuilding cycle lags, 2009–2011 still saw large numbers of pre-crisis ordered new ships delivered, further exacerbating supply-demand imbalances.
Figure 10. Global Shipping Capacity Changes (2009–2018)
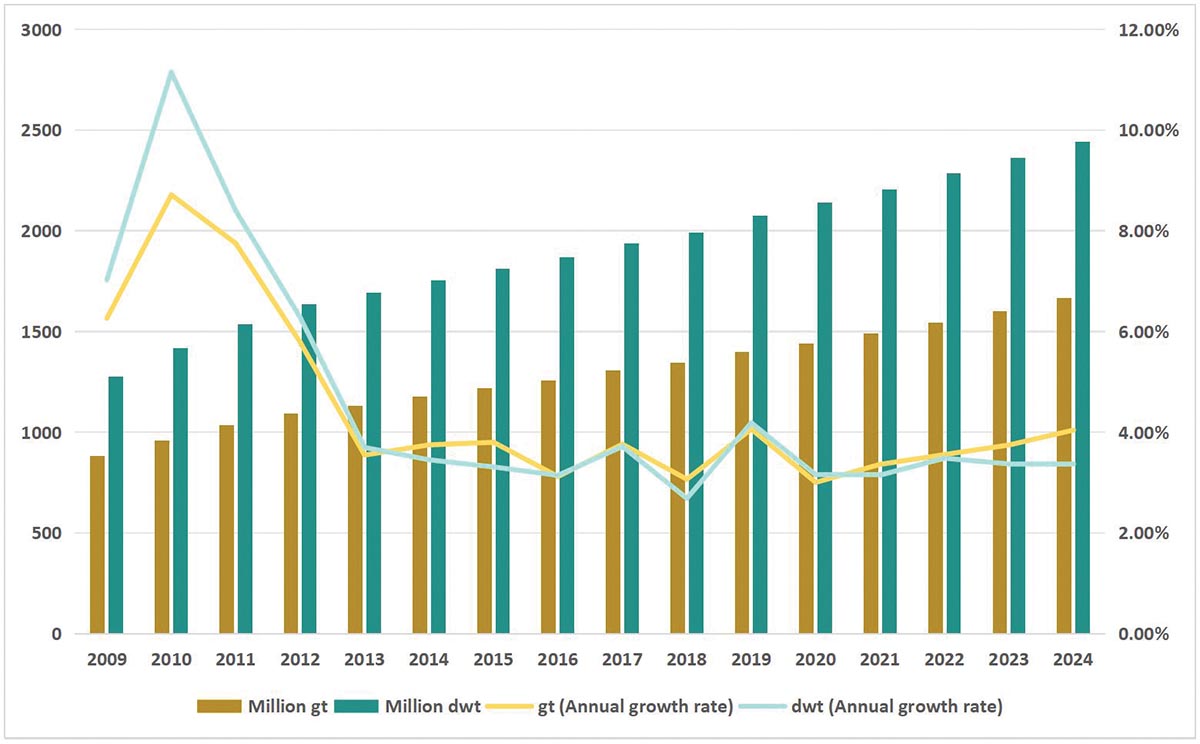
During this period, global merchant fleet grew from approximately 1.28 billion deadweight tons in 2009 to 2.07 billion deadweight tons in 2019, with an average annual growth rate of about 5%. In fleet structure changes, bulk carriers increased from 450 million deadweight tons to 840 million deadweight tons, with proportions rising from 35.1% to 42.6%; tankers increased from 480 million deadweight tons to 570 million deadweight tons, with proportions declining from 37.5% to 28.7%; container ships increased from 160 million deadweight tons to 270 million deadweight tons, with proportions rising from 12% to 13.4%. Liquefied gas carriers showed the most significant capacity growth speed, increasing from 36.3 million deadweight tons to 69.1 million deadweight tons, growing at a high pace (around 6–9% per year, depending on metric and subperiod).
Figure 11. World Fleet Deadweight Tonnage Growth 2013–2018 (Annual Percentage Change)
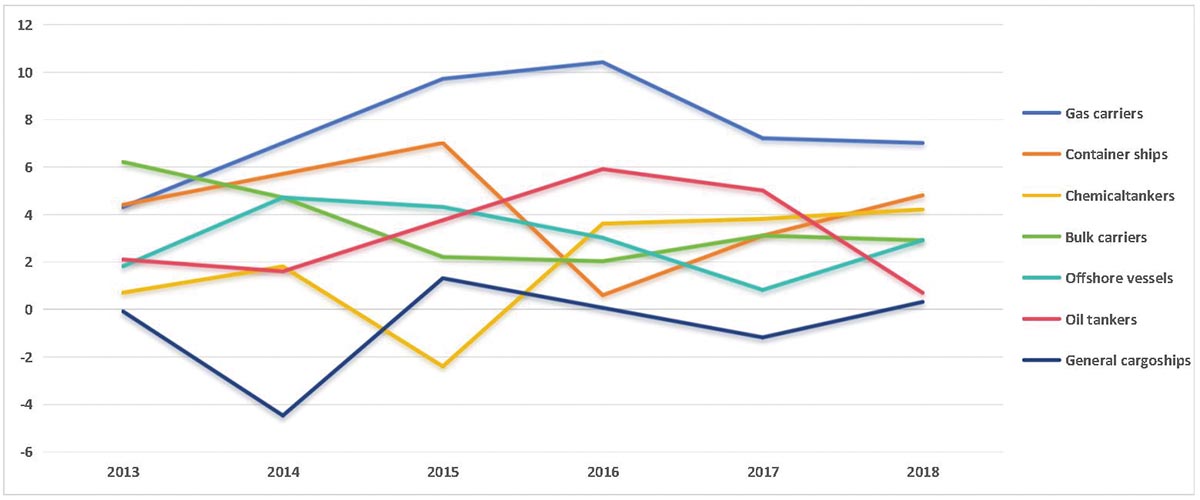
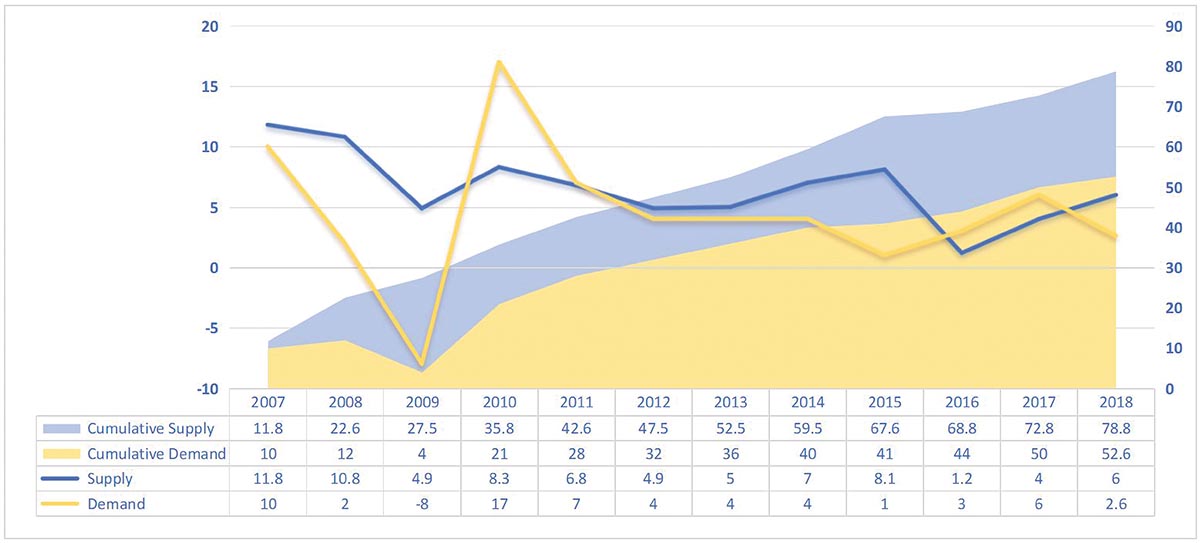
Global capacity supply growth during this period far exceeded demand growth, causing continuous decline in global fleet operational efficiency and long-term severe supply-demand mismatches in the shipping industry. Particularly in container shipping markets, during 2009–2012, global container fleet capacity increased 45% while demand increased only 12%, with almost all major liner companies falling into losses.
Figure 12. World Fleet Container Transport Demand and Supply Growth 2007–2018 (Annual Percentage)
2.4.2 Great Consolidation Era: Industry Integration and Alliance Restructuring
Facing survival crises, the shipping industry launched consolidation waves. Container shipping bore the brunt, experiencing the most dramatic restructuring. Global container shipping underwent multiple rounds of mergers and acquisitions, significantly increasing industry concentration.
In 2016, CMA CGM's acquisition of Neptune Orient Lines (NOL) was completed, after which the group consolidated its position among the top liner companies (CMA CGM, 2016); in 2017, Maersk's acquisition of Hamburg Süd gave Maersk dominance on South American routes (Maersk, 2017). These mergers not only changed market patterns but, more importantly, promoted operational model transformations.
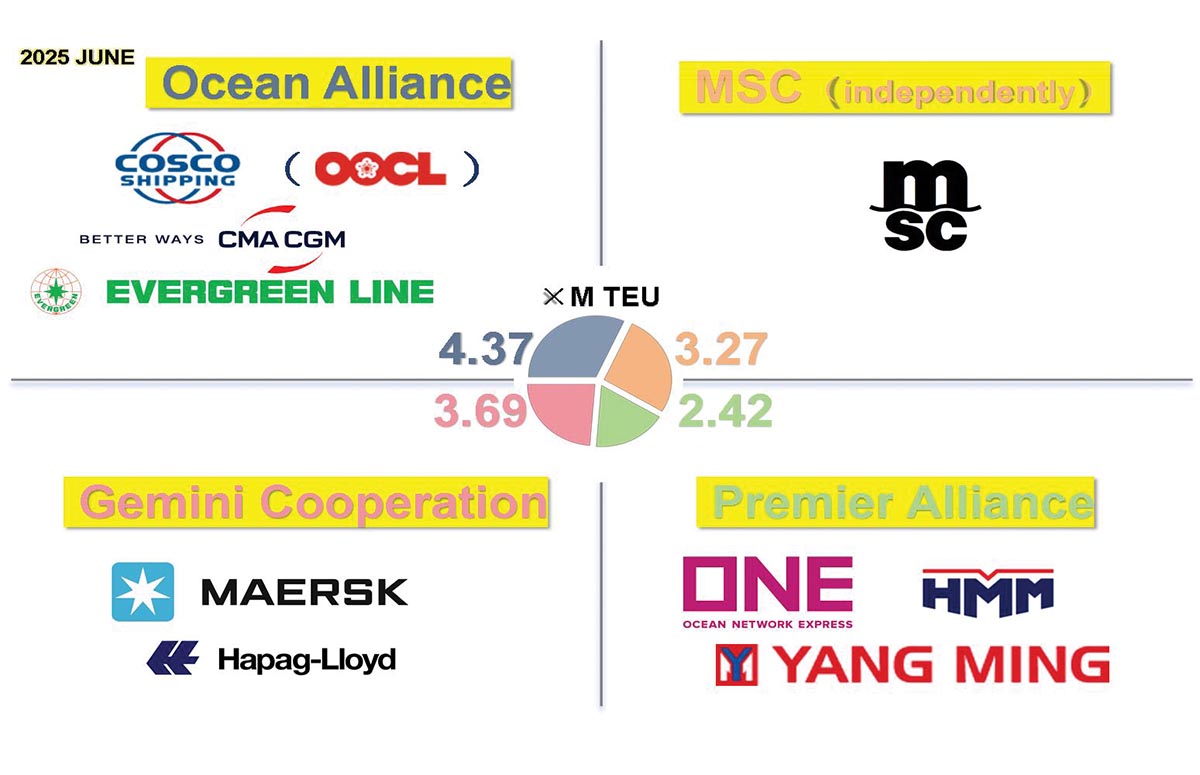
Concurrent with mergers was alliance restructuring. In 2017, global container shipping alliances completed historic restructuring: from four major alliances (2M Alliance, Ocean Alliance, THE Alliance, and CKYHE) to three major alliances (2M, Ocean Alliance, and THE Alliance). The three major alliances collectively controlled over 90% of East-West Main Line capacity:
- 2M Alliance: Maersk + Mediterranean Shipping Company (MSC), controlling 35% of East-West Main Line capacity;
- Ocean Alliance: COSCO SHIPPING + CMA CGM + Evergreen + OOCL, controlling 40% capacity;
- THE Alliance: Nippon Yusen Kabushiki Kaisha (NYK) + Mitsui O.S.K. Lines (MOL) + Kawasaki Kisen Kaisha (K Line) + Hapag-Lloyd, controlling 25% capacity (Allyn International, 2017).
As of 2025, the industry is transitioning toward a structure with OCEAN Alliance, Gemini Cooperation, an additional alliance framework on select trades, and MSC operating independently on mainlines. Specific labels and membership may evolve; we therefore use descriptive terminology and indicate the reference date in captions.
Figure 13: Global Container Shipping Alliance 2025
2.5 Pandemic Impact and New Order (2020–2025): Black Swan Events and Supply Chain Restructuring
2.5.1 Pandemic Impact: From Demand Collapse to Capacity Shortage
The COVID-19 pandemic outbreak in early 2020 caused and unprecedented impact on the global shipping industry. Initial lockdown measures led to sharp global trade contraction, with global maritime trade volumes declining over 10% in Q2 2020, the largest drop since the 2009 financial crisis.
However, with massive stimulus policies and "stay-at-home economy" emergence, consumer goods demand rebounded rapidly, but supply chains could not respond timely. Port congestion, container shortages, crew change difficulties, and other factors combined to significantly reduce effective capacity. Container market demand increased 11% in 2021 while capacity increased only 4.5%. At points in Q1 2021, roughly low-double-digit percentages of global container capacity were effectively tied up in port congestion, equivalent to approximately 2–4 million TEU of effective capacity, depending on the denominator and method. Port congestion peaked in 2022, with high double-digit percentages reported on some routes/ports depending on the metric (ships, TEU-weeks, or voyages). We refer to ‘elevated congestion' rather than a single global point estimate.
2.5.2 New Ship Order Explosion and Shipbuilding Industry Order Reshaping
During this period, surging excess profits sparked an explosive rise in new vessel orders. In 2021, Container ship new orders reached 5.5 million TEU, 23% of existing fleet, creating historic highs.
The Global orderbook included 4,029 vessels totaling 237.3 million deadweight tons in 2022. In 2023 orderbook expanded to 4,870 vessels, 283 million deadweight tons. By 2024, order total value reached $405.5 billion, increasing 20.7% from 2023.
2.5.3 Capacity Growth "New Normal": A Return to Rationality
After dramatic pandemic fluctuations, global maritime capacity growth is returning to rationality. Global fleet capacity reached approximately 2.4 billion deadweight tons in 2024, with 2023 capacity annual growth rate of 3.4%, below the 2005–2023 average of 5.2%. Growth speeds are stabilizing.
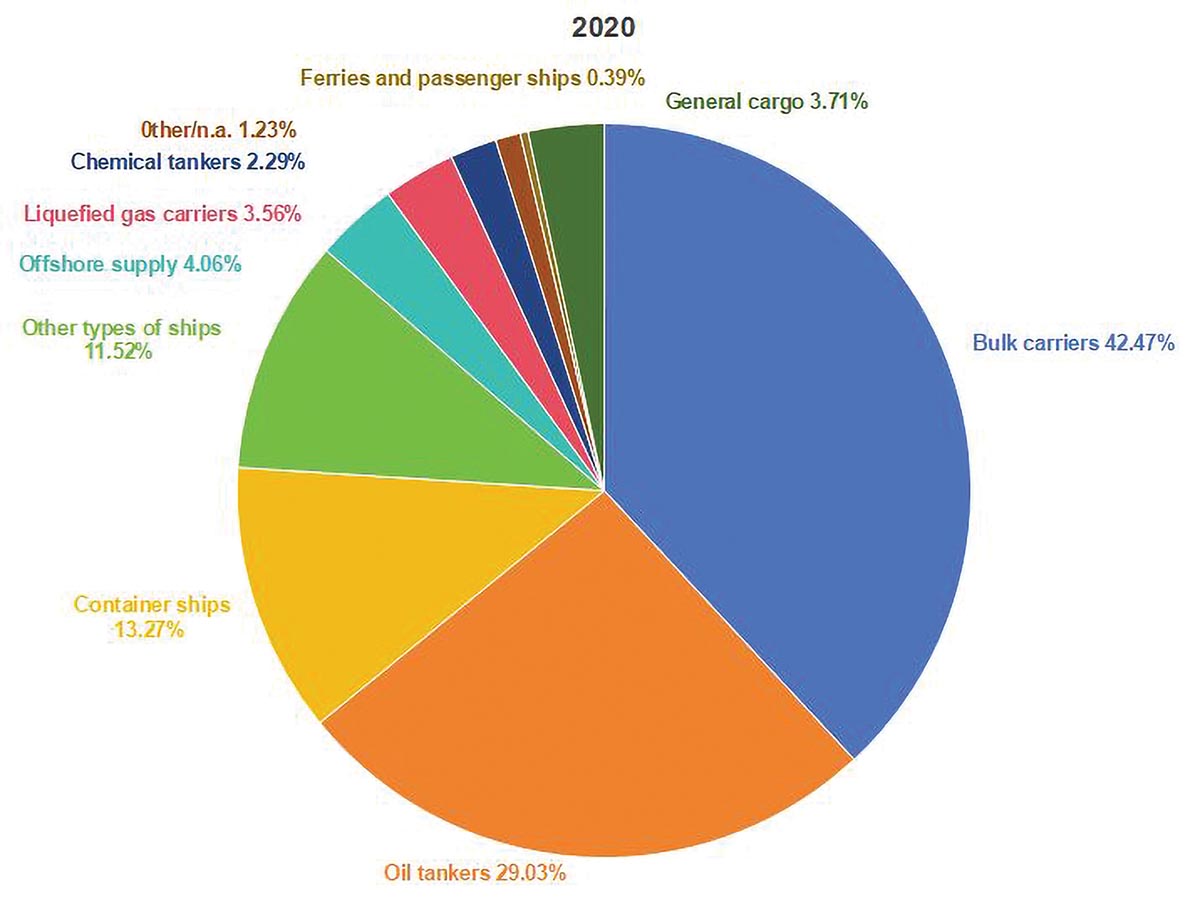
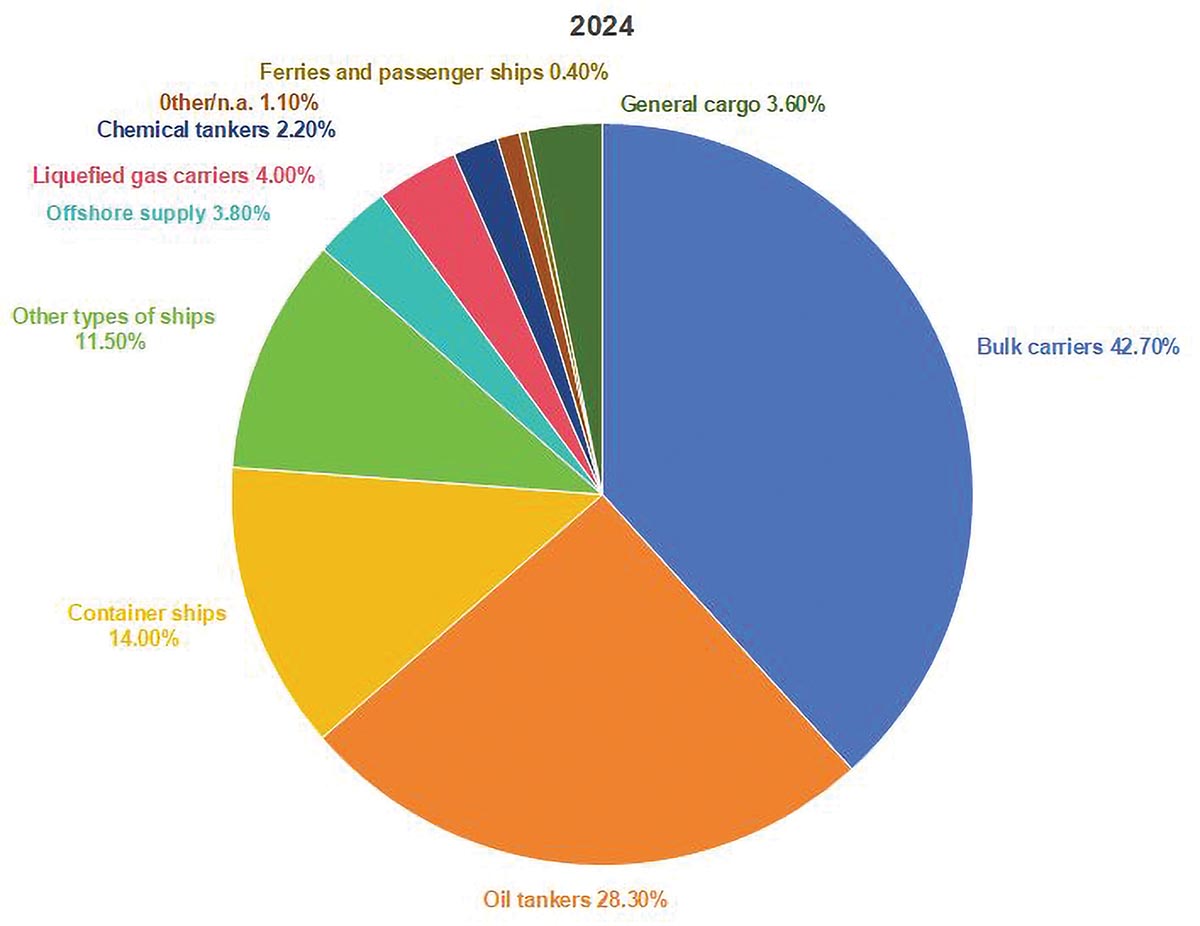
In global fleet structure, bulk carriers account for 42.7%, remaining the largest ship type; tankers account for 28.3%, significantly affected by energy transition; container ships account for 13.3%; other ship types account for 15.7%.
Table 1. World Fleet by Principal Vessel Types 2020–2024 (Thousand Deadweight Tons and Percentage Change)
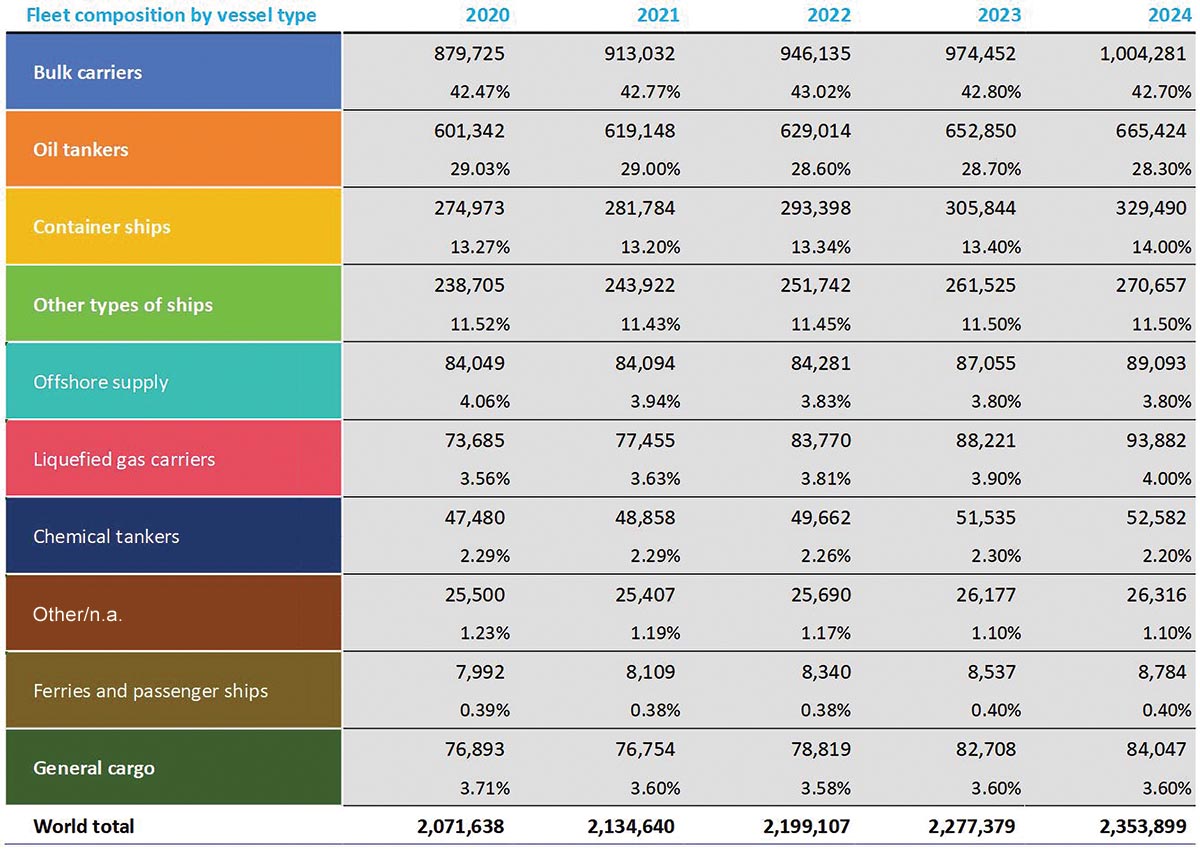
Figure 14. World Fleet Structure 2020 and 2024 (Annual Percentage)
3. Regional Capacity Structure Changes
The global maritime capacity regional patterns have undergone profound historic changes over the past 75 years, clearly reflecting the eastward trajectory of world economic centers and fundamental restructuring of global industrial division patterns.
In the early post-war period, European and American countries controlled most global merchant capacity, with 8 of the top 10 shipowning countries being European and American, collectively controlling over 70% of global capacity. The United Kingdom controlled approximately 25% of global merchant capacity, while traditional maritime powers like Norway, Netherlands, and Germany also held significant shares. European countries, with their advanced shipbuilding technology and vast colonial trade networks, occupied absolutely dominant positions in global maritime capacity distribution, forming Atlantic trade circle-centered patterns.
Following the 1970s oil crisis, Japan's shipping industry achieved strategic rise. Japanese shipowners' controlled capacity surged from approximately 8% in 1973 to over 15% by the late 1980s, establishing Japan as the world's second-largest shipowning nation. During the same period, Europe's share declined from 45% in 1970 to 35% in 1990, while the United States experienced relative decline from 20% to 12%. These changes marked the first major breakthrough by Asian forces in global maritime capacity distribution, breaking the traditional monopoly held by European and American countries.
In the 1990s, globalization waves drove the collective rise of Asian emerging economies, with the shipping capacity center of gravity beginning to shift eastward significantly. South Korean shipowners' capacity increased from 2% in 1990 to 5% in 2010, joining the world's top five shipowning nations. After 2000, China emerged and gradually became a significant force reshaping global order. Chinese shipowners' controlled capacity rapidly expanded from 25 million deadweight tons in 1990 to 84.88 million in 2008, with global ranking leaping from eighth to fourth position. Asia's overall capacity share increased from 25% in 1990 to 40% in 2008, becoming one of the global maritime capacity centers.
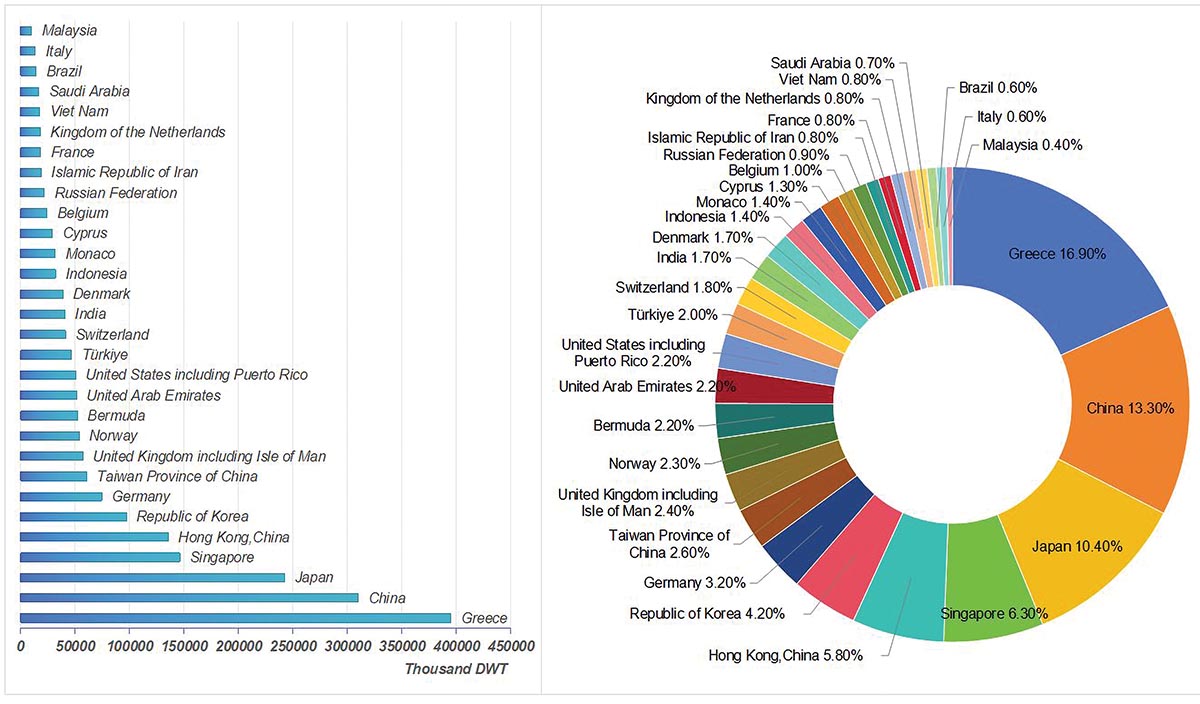
By 2024, Greece maintains its position as the world's largest shipowner with controlled capacity of 395 million deadweight tons, accounting for 16.9% of global total capacity. China follows with controlled capacity of 310 deadweight tons, representing 13.3% of global share. Japan, Singapore, Hong Kong (China), and South Korea all rank among the global top ten, with Asia's top five shipowning countries collectively control a substantial share of global capacity (over 40% by many ownership definitions).
Figure 15. World fleet ownership by capacity 2024 (dead weight tons)
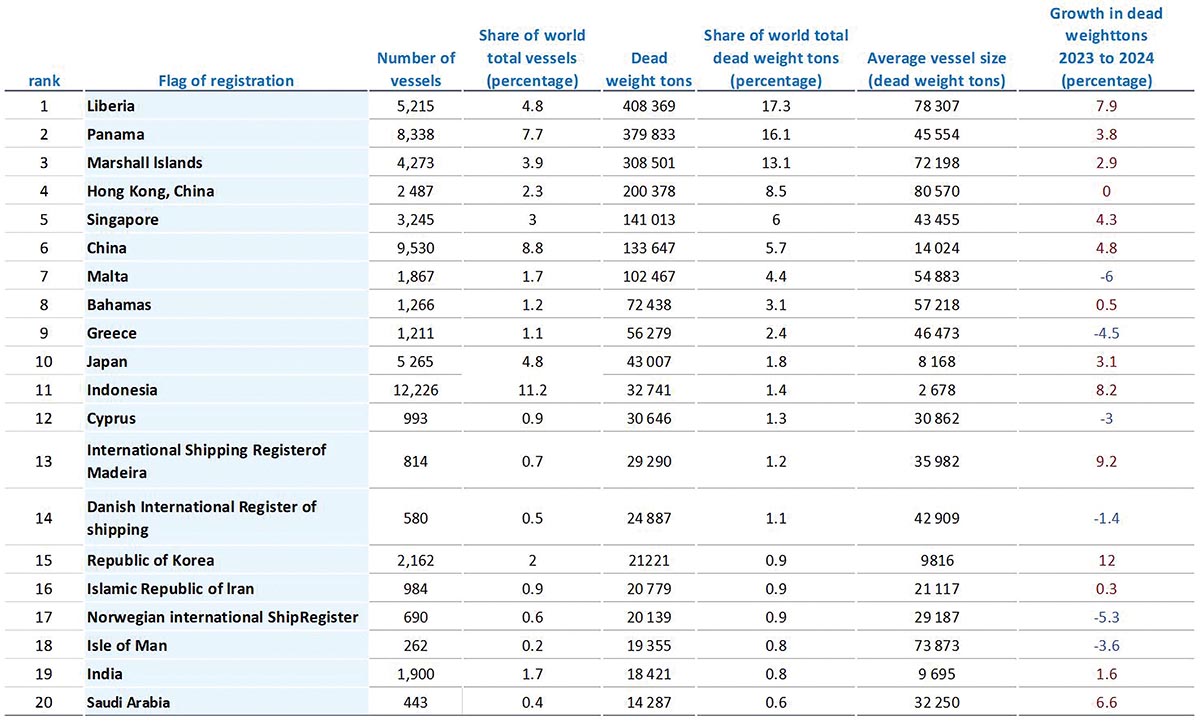
However, the separation between flag states and shipowning countries has become increasingly evident, with over 70% of global shipping capacity registered under foreign flags, dominated by open registry countries such as Liberia, Panama, and the Marshall Islands. The 2024 flags of registration distribution shows Liberia leading with 17.3% (415 million DWT), followed by Panama with 16.1% (386 million DWT), and the Marshall Islands with 13.1% (314 million DWT). More than 70% of global shipping capacity is registered under foreign flags, with 7 out of the top 10 flag states being open registry countries. Developed economies own more than half of global capacity, yet 76% of this capacity is registered under developing economy flags.
Table 2. Global leading flags of registration by dead weight tons, as of 2024
4. Future Five-Year Prospective Analysis
Based on historical data and current market conditions, global maritime capacity development over the next five years will exhibit new characteristics of rational growth, structural optimization, and green transition.
From a supply-demand perspective, on the supply side, the container ship sector's orderbook stands at approximately 5.5 million TEU (representing 23% of existing fleet size). This substantial pending delivery capacity will be concentrated between 2025 and 2028, significantly impacting market supply-demand balance. Dry bulk and tanker orderbooks are relatively moderate (approximately 15% and 12% of existing fleets respectively), but considering the longer construction cycles for these vessel types, their market impact will be more enduring. Meanwhile, global fleet aging has become increasingly prominent, providing another important driver for future capacity structural adjustment. The current global fleet's average age has reached 12.5 years, with over half of vessels exceeding 15 years. Against the backdrop of increasingly stringent environmental regulations and rising operational efficiency requirements, approximately 20% of aging vessels will face mandatory retirement or voluntary renewal over the next five years. Global maritime capacity over the next five years will achieve relatively stable growth amid deep structural adjustment, with average annual growth rates expected to remain within the reasonable range of 2.7–3.4%.
Structural change trends will become more pronounced over the next five years. While vessel upsizing trends will continue, their marginal effects are diminishing. Port infrastructure limitations, route network compatibility requirements, and risk concentration considerations mean that ultra-large vessels' economic advantages are no longer as evident as in the past. Future additional capacity will focus more on flexibility and market adaptability rather than purely pursuing maximum scale. Structural growth in specialized vessel demand will become an important trend, with strong growth momentum expected for specialized vessels such as LNG bunkering ships, chemical tankers, and car carriers.
Green transition will become the most important force driving fleet renewal. The establishment of IMO's 2050 net-zero emission target will significantly accelerate the global fleet's greening process. By 2030, green vessels are expected to account for over 80% of new ships, with dual-fuel vessels dominating new orders, and alternative fuels such as ammonia, methanol, and hydrogen achieving widespread application. However, technological pathway uncertainty remains a major challenge facing the industry.
Accelerated market consolidation trends will further reshape industry competitive landscape. Industry concentration will continue rising with more pronounced Matthew effects, as major shipping companies further expand market share and influence through mergers, acquisitions, and strategic alliances. In specialized niche markets and innovative service areas, significant opportunities for differentiated development still exist. The eastward shift trend in regional patterns will continue deepening, with Asia, particularly China, further enhancing its influence and voice in the global shipping industry.
5. Conclusions
In today's era of deepening globalization and sustainable development as the zeitgeist, the shipping industry carries a central role in connecting global supply chains and facilitating trade, with its development trajectory continuing to profoundly influence the future direction of the world economy. Looking back at the global maritime capacity development from 1950 to 2025, we witness how an industry has continuously adapted, transformed, and reshaped itself amid historical currents. From the golden age of post-war reconstruction to deep adjustments during oil crises, from capacity explosions during globalization waves to rational returns after financial crises, and to supply chain restructuring under pandemic impacts, each major transformation has profoundly changed the global shipping industry's landscape.
Looking ahead, the global shipping industry stands at a new historical starting point. Green transition and digital upgrading will become the twin engines driving industry development. Those enterprises capable of achieving breakthroughs in technological innovation and business model innovation will occupy commanding heights in the new round of global competition. History proves that transformation presents both challenges and opportunities. Only by actively embracing change and courageously pursuing innovative breakthroughs can the industry continue writing brilliant chapters in shipping's next era.
Data Source
All data presented in this paper, including figures, tables, statistical analyses, and projections, are based on UNCTAD calculations using data provided by Clarksons Research Services, supplemented by Lloyd's Register World Fleet Statistics.
Attribution
Unless otherwise noted, all statistical content throughout this paper derives from UNCTAD calculations based on Clarksons Research Services data and supplementary sources listed above. Data interpretation and conclusions are the authors' own.
Declaration of Competing Interest
The authors declare that they have no known competing financial interests or personal relationships that could have appeared to influence the work reported in this paper.
- Allyn International (2017, April 1). The New Ocean Alliances. https://www.allynintl.com/news-publications/entry/the-new-ocean-alliances
- BRS Shipbrokers (2018–2025). Shipping and Shipbuilding Markets Annual Review Series 2018–2025. https://www.brsshipbrokers.com/publications
- Clarksons Research Services (1992–2025). Shipping Review & Outlook Series 1992–2025. https://www.clarksons.net/n/#/sin/reports/16;e=%5B53804%5D;s=53804;c=%5B%5D/grid
- Clarksons Research Services (2025). Timeseries and Graphs. Orderbook by ship type, all vessels. Retrieved at July 1, 2025. https://www.clarksons.net/n/#/sin/timeseries/browse;e=%5B51491,49750%5D;c=%5B56653%5D/(ts:data/100/latest;t=%5B44930,45005,45082,45161,542189%5D;l=%5B44930,45005,45082,45161,542189%5D;listMode=false;viewMode=Grid)
- Clarksons Research Services (2025). World Fleet Monitor, 16 (7). https://www.clarksons.net/n/#/sin/reports;e=%5B254%5D;s=254;c=%5B%5D/grid
- CMA CGM. (2016, April 29). CMA CGM' s Proposed Acquisition of NOL Approved by the European Commission. https://www.cma-cgm.com/news/1149/cma-cgm-s-proposed-acquisition-of-nol-approved-by-the-european-commission
- Danish Ship Finance. (2004-2025). Shipping Market Review Series 2004–2025. https://skibskredit.dk/research-2/research/
- Drewry Maritime Research. (2025). Container Forecaster, 2 (1).
- Equasis. (2005–2022). The World Merchant Fleet - Statistics From Equasis Series 2005–2022. European Maritime Safety Agency. https://www.emsa.europa.eu/publications/reports/item/472-annual-statistical-report-on-the-world-merchant-statistics-from-equasisics-from-equasis.html
- Lloyd's Register Foundation. (1950–2024). World Fleet Statistics Series 1950–2024. Lloyd's Register Fundation. https://hec.lrfoundation.org.uk/archive-library/world-fleet-statistics
- Maersk. (2017, April 28). Maersk Line A/S to Acquire Hamburg Süd—Sale and Purchase Agreement Approved. https://investor.maersk.com/news-releases/news-release-details/maersk-line-acquire-hamburg-sud-sale-and-purchase-agreement-0
- Stopford, M. (2008). Maritime Economics (3rd ed.). Abingdon: Routledge.
- The United Nations Conference on Trade and Development. (1968–2024). Review of Maritime Transport Series 1968–2024. https://unctad.org/publications-search
- The United Nations Conference on Trade and Development. (2025). Maritime transport - Merchant fleet. UNCTADstat Data centre. https://unctadstat.unctad.org/datacentre/